Geoscience Reference
In-Depth Information
and 3.2%, respectively. Because increasing tem-
perature decreases velocities, one way to make
the high values of
G
0
consistent with PREM is
to impose a superadiabatic gradient in the lower
mantle, and another is a continuous change in
chemical composition with depth. However, the
result by applying new
G
0
values strongly sup-
ports that the shear velocity profile can remark-
ably well reproduce the 1-D global seismic model
with simple assumptions of representative adia-
batic geotherms and uniform composition model
within the lower mantle. In order to make the
effect of temperature on the final result more
clear, we also calculated the best-fit tempera-
ture profile for the pyrolitic lower mantle to
satisfy the PREM profile. As shown in Figure 6.11,
the best-fit temperature profile is found to be
∼
7.6
G'
PV
= 2.0
G'
PV
= 1.8
7.2
6.8
G'
MgO
= 2.2
6.4
6.0
PREM
Fp (
G'
MgO
= 2.20)
Pv (
G'
MgSiO
3
= 2.0)
Pv (
G'
MgSiO
3
= 1.8)
5.6
Best Fit (
G'
PV
= 2.0)
Best Fit (
G'
PV
= 1.8)
Best Fit (
X
PV
= 0.92)
Pyrolite (
X
PV
= 0.80)
Pv (Murakami
et al
., 2007)
Fp (Murakami
et al
., 2009)
5.2
30
40
50
60
70
80
90 100 110 120 130
Presssure (GPa)
(a)
7.6
1000 K colder than the other lower man-
tle geotherms, which is highly unlikely condition
in the current Earth's mantle.
Present results indicate that the conventional
peridotitic mantle model is not compatible with
the seismic properties of the lower mantle, even
considering the experimental uncertainties, and
strongly suggest that the lower mantle is domi-
nated by perovskite, which implies that the lower
mantle is chemically distinct from the upper
mantle. This consequence further includes the
crucial insights into the remaining issues on the
primordial Earth's building material, differentia-
tion process in the magma ocean in early Earth,
mass transport between upper and lower mantle,
and the secular change in convection styles of the
mantle through Earth's history, which could sig-
nificantly reshape our view of the Earth's mantle
and its evolution.
Although further experimentations for shear
wave velocities under more realistic chemical
composition, expanding to multi-component
system including Al
2
O
3
, CaO and so on, and
relevant high-temperature condition will be
required for more detailed modeling of the
lower mantle, the present modeling result based
on the new elasticity data determined under
relevant pressure throughout the lower mantle
should impose the strong constraints upon this
issues.
400
−
7.2
6.8
6.4
6.0
5.6
PREM
Pv (Murakami
et al
., 2007)
Fp (Murakami
et al
., 2009)
Pyrolite (
X
PV
= 0.80)
5.2
30
40
50
60
70
80
90 100 110 120 130
Presssure (GPa)
(b)
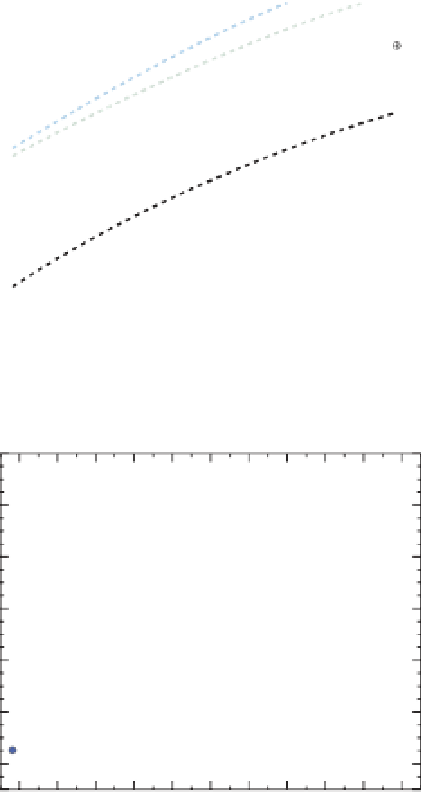
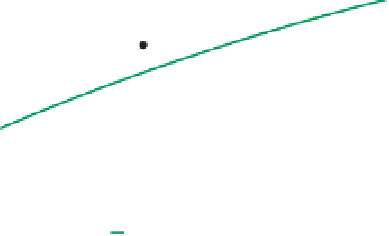
Fig. 6.12
Calculated shear wave velocity profiles of
ferropericlase and perovskite as a function of pressure
along the geotherms for whole mantle convection
model (Brown & Shankland, 1981). Reproduced with
permission of John Wiley & Sons (a), and for layered
mantle convection model (Anderson, 1982) (b), along
with the PREM model. Black circles, (Mg, Fe)SiO
3
perovskite with
X
Mg
of 0.94; blue circles, (Mg,Fe)O
ferropericlase with
X
Mg
of 0.79; white circles with
cross, PREM. Red line indicates the best fit profile to
PREM (
X
Pv
=
0.92). The shear wave velocity profile of
simplified pyrolite model (
X
Pv
=
0.80) is also shown as
green line. The dashed lines shows the profiles of both
pv and fp calculated from the higher
G
0
values, and the
best fit profiles using their higher
G
0
are shown as
light blue and light green lines. (See Color Plate 2).