Geoscience Reference
In-Depth Information
Table 6.2
Selected aggregate shear elastic properties of MgO.
G
0
G
0
(GPa
-1
)
Source
G
0
(GPa)
V
s0
(km/s)
max P
(GPa)
Remarks
Experiments
Murakami
et al
. (2009) (3rd order)
130.9(11)
1.92(2)
-
6.04(2)
128
Brillouin spectroscopy
Murakami
et al
. (2009) (4th order)
130.3(25)
1.92(11)
−
0.020(2)
Sinogeikin and Bass (2000)
130.2(10)
2.21(10)
-
6.03(2)
18
Brillouin spectroscopy
Zha
et al
. (2000)
130.4(17)
2.85(9)
−
0.084
6.06(3)
55
Brillouin spectroscopy
Yoneda (1990)
131.1
2.41
-
6.05
8
Ultrasonic interferometry
Jackson and Niesler (1982)
130.9
2.53
−
0.033
6.04
3
Ultrasonic interferometry
Spetzler (1970)
131.1
2.45
-
6.05
0.8
Ultrasonic interferometry
Kono
et al
. (2010)
127.9(2)
2.49(1)
-
5.987(4)
23.6
Ultrasonic interferometry
Chopelas (1996)
*
130.9(5)
2.56
−
0.030(10)
6.05(1)
37
Flourescence spectroscopy
Theory
Karki et al. (1997)
122
2.18
−
0.034
5.91
-
0 K
Karki et al. (1999)
128
2.44
-
5.97
-
300 K
Numbers in parentheses are standard deviation uncertainties in the last digit(s).
*
Cr
3+
-doped MgO was used for fluorescence sideband method.
the possible deformation of single-crystal MgO
under high-pressure condition.
Based on the previous acoustic measurements
on ferropericlase (Kung
et al
., 2002; Jackson
et al
., 2006), the effect of iron concentration in
(Mg,Fe)O on
G
0
can be estimated. (Jacobsen
et al
.,
2002) examined the systematic change in
G
0
of
(Mg,Fe)O as a function of iron content based on
the results by GHz ultrasonic interferometry at
ambient pressure. Their study clearly shows the
non-linear relationship between
G
0
and iron con-
tent. On the other hand, the pressure dependence
of shear modulus of ferropericlase was previously
investigated using ultrasonic interferometry on
(Mg
0.83
,Fe
0.17
)O to 9 GPa (Kung
et al
., 2002),
and Brillouin spectroscopy on (Mg
0.94
,Fe
0.06
)O to
20 GPa (Jackson
et al
., 2006). In ferropericlase,
the occurrence of the spin transition of iron
at around 50 GPa was recently reported (Badro
et al
., 2003), which gives rise to an intensive
discussion on its effect to the elasticity. Recent
high-pressure impulsive stimulated scattering
(Crowhurst
et al
., 2008) on (Mg
0.94
,Fe
0.06
)O to
∼
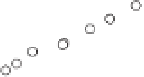
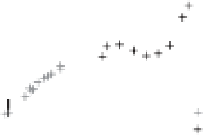
shear wave profile across the spin transition
(Figure 6.9). While Crowhurst
et al
. (2008)
reported the shear softening at spin transition
pressure, very recent Brillouin scattering results
did not show clear evidence of such shear
softening, but exhibited a relatively gentle slope
8.0
HS
HS-LS
LS
7.6
7.2
6.8
6.4
(Mg,Fe)O
6.0
X
Mg
= 0.94 (Jackson
et al
., 2006)
X
Mg
= 0.94 (Crowhurst
et al
., 2008)
X
Mg
= 0.90 (Marquardt
et al
., 2009)
MgO (Murakami
et al
., 2009)
5.6
5.2
0
20
40
60
80
100
120
Pressure (GPa)
Fig. 6.9
Representative high-pressure shear wave
velocity profiles (Crowhurst
et al
., 2008; Jackson
et al
.,
2006; Marquardt
et al
., 2009) of ferropericlase together
with that of MgO (Murakami
et al
., 2009). Shaded area
shows the possible pressure range of the spin
transition. HS, high-spin state of iron; LS, low-spin
state of iron. (See Color Plate 2).
60 GPa and Brillouin scattering measurements
(Marquardt
et al
., 2009) on (Mg
0.94
,Fe
0.06
)O up to
∼
80 GPa demonstrated the shear wave velocity
evolution around iron spin transition pressure
regime, showing the anomalous/discontinuous