Geoscience Reference
In-Depth Information
of perovskite. The velocity difference between
them reaches 2% at 172 GPa, the maximum pres-
sure experimental point in (Murakami
et al
.,
2007). Seismological studies suggest that a pos-
itive velocity jump of 2.75% (Wysession
et al
.,
1998) is typical for the D
discontinuity, with
greater values being relatively rare. The extrapo-
lated phase transition boundary at room tempera-
ture inferred from Murakami
et al
. (2004) is about
110 GPa. However, the aggregate shear wave ve-
locity contrast between MgSiO
3
perovskite and
post-perovskite is 0.5% at most up to the pres-
sures of 125 GPa. Thus, the magnitude of a dis-
continuity created by the perovskite to post-
perovskite phase transition would therefore be
much smaller than usually observed for the D
discontinuity, at least at room temperature.
This results suggest that an isochemical phase
change in MgSiO
3
, with isotropic aggregates of
perovskite and post-perovskite on either side of
the phase boundary, is unlikely to provide the
velocity contrast required by the D
discontinu-
ity. The effect of temperature on the velocity
jump will certainly be important. The results
of first-principles calculations for the MgSiO
3
perovskite to post-perovskite phase transition in-
dicate that temperature tends to increase the
V
S
change at the discontinuity to
143 GPa
-10
-5
0
5
10
Velocity (km/s)
(a)
8.8
8.6
8.4
8.2
8.0
7.8
7.6
7.4
MgSiO
3
post-perovkskite
PPv
(G
0
= 136, G
0
' = 2.0)
Pv
(G
0
= 173, G
0
' = 1.56)
7.2
7.0
6.8
60
80
100
120
Pressure (GPa)
140
160
180
200
(b)
1% (Iitaka
et al
.,
2004). While the experimental verification of the
temperature effect is surely needed, the relevant
experiments cannot be done at the present time.
Nevertheless, the remarkable agreement between
the experimental results and computational cal-
culations may leave open the possibility that
there is a mismatch between the magnitude of
the D
discontinuity in shear waves, and the
experimentally measured jump in
V
S
.
Recent seismic observations suggesting rela-
tively small discontinuities of about 0.6
∼
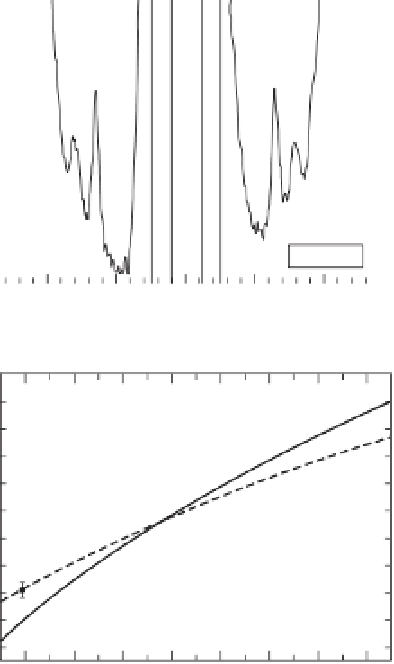
Fig. 6.6
Representative high pressure Brillouin
spectrum of MgSiO
3
post-perovskite phase (PPv) (a),
and shear wave velocities of MgSiO
3
perovskite (filled
circles) and post-perovskite phase (open circles) as a
function of pressure at 300 K (b) from Murakami
et al
.
(2007b). Third-order Eulerian finite strain fits are
shown by solid line for post-perovskite and dashed line
for perovskite, respectively. The shaded area indicates
the shear velocity jump of 2.5
4.0% (Wysession
et al
., 1998) from that of perovskite from 100 to 125
GPa. Reproduced with permission of Elsevier.
−
−
1.1%
in shear wave beneath Central Pacific region (Lay
et al
., 2006), could correspond to the isotropic
phase transition of perovskite to post-perovskite.
Alternatively, it is possible to explain the more
typical larger seismic velocity constast by lattice
preferred orientation (LPO) of the post-perovskite
phase (Murakami
et al
., 2004; Iitaka
et al
., 2004).
The post-perovskite phase is thought to have
in MgSiO
3
at pressures corresponding to the
D
discontinuity can be quantitatively assessed.
As shown in Figure 6.6b, the best-fit curves
of the Eulerian finite strain equations for each
phase intersect at
115 GPa. At higher pres-
sures, the aggregate shear velocity for the post-
perovskite phase increases more rapidly than that
∼