Geoscience Reference
In-Depth Information
elements such as iron and hydrogen among
minerals will change with depth. Particularly
important is the depth variation in hydrogen par-
titioning. We include this effect using the results
by Irifune and Isshiki (1998); Bolfan-Casanova
(2005); Mookherjee and Karato (2010); Mierdel
and Keppler (2004).
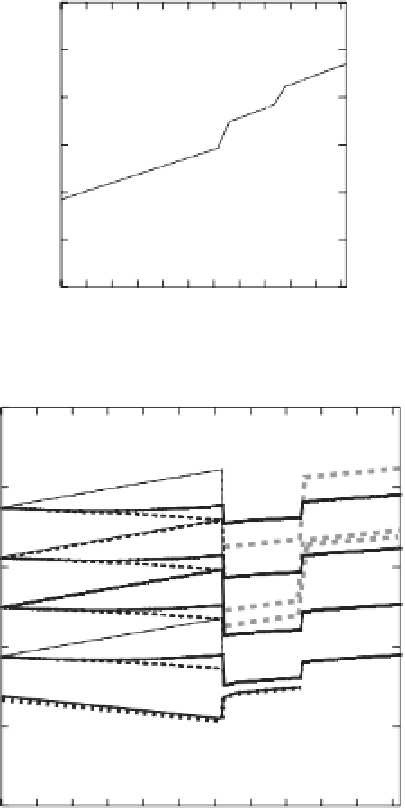
Because the temperature variation is small and
the major element chemistry changes only in a
narrow range in the mantle, most of the spatial
(depth or lateral) variation in electrical conduc-
tivity can be attributed to the variation in water
(hydrogen) content. In our model calculation, we
leave the water content as a free parameter and ex-
plore a range of its value from zero (dry) to nearly
saturated values. The composition including the
hydrogen content (measured as a total water
content) is kept constant with depth. This corre-
sponds to a model of mantle convection without
any large chemical fractionation in the mantle.
These results can be compared with geophysi-
cally inferred electrical conductivity. Figure 5.16
summarizes the depth and regional variation of
electrical conductivity inferred from the analy-
ses of electromagnetic induction (mostly from
Kelbert
et al
. 2009; see also Khan
et al
., 2011).
Inversion of these data is non-unique, and in par-
ticular, the depth variation in conductivity is only
loosely constrained. If one does not assume any
abrupt changes in conductivity with depth, then
one will obtain a smoothly varying conductivity
with depth. In some of the inversions, discontinu-
ities in conductivity are assumed at certain depths
motivated by mineral physics observations and
the jump in conductivity is estimated.
Although uncertainties are large, some robust
conclusions can be obtained about the distri-
bution of electrical conductivity in the Earth's
mantle:
• Electrical conductivity in the asthenosphere
is
2000
1900
1800
1700
1600
1500
1400
100
200 300
400
500
600
depth, km
(a)
10
CW=1 wt %
1
1
0.1
“1 wt %”
0.1
10
-1
0.01
“0.1”
“dry”
0.01
0.001
10
-2
0.001
10
-3
dry
10
-4
100
200
300
400
500
600
depth, km
(b)
Fig. 5.15
Electrical conductivity-depth profiles in
Earth's upper mantle and transition zone (from Karato,
2011) for various fixed water (hydrogen) content.
(a) The assumed geotherm. (b) The calculated
conductivity-depth profiles. The depth variation in the
oxygen fugacity is included in the calculation based on
the model by Frost and McCammon (2008). Water
content is assumed to be constant with depth. Thick
broken lines in the transition zone are the results by
Yoshino (2010) based on the incorrect method of
conductivity measurements (see text for details) and
their ''dry'' samples contain
10
−
2
S/m on average, but locally near the
top of the asthenosphere conductivity reaches
∼
∼
10
−
1
S/m. Electrical conductivity of the as-
thenosphere in the western Pacific is unusually
low,
0.01-0.1wt %
of water. Reproduced with permission of Elsevier.
∼
10
−
3
S/m.
• Electrical conductivity in the transition zone is
generally higher than that in the asthenosphere.
∼


