Geoscience Reference
In-Depth Information
and
This suggests that the mobility of hydrogen in
(
H
Al
)
Si
is higher than that in (2
H
)
M
.
Figure 5.10 compares the electrical conductiv-
ity of hydrogen-bearing minerals including hy-
drous minerals (for the water content of 0.01
wt %). A comparison ismade for
X
Fe
≈
·
[
H
•
]
for [
Fe
•
M
]
[
H
M
]
∝
f
3
/
4
H
2
O
f
−
1
/
8
=
(5.21b)
O
2
respectively. The experimental observations for
of
r <
1 olivine, wadsleyite and ringwoodite and
q <
0 (for wadsleyite) are consistent with a model
where much of the current is carried by free
proton
H
•
not by a neutral defect (2
H
)
M
.
The ratio of concentration of mobile free pro-
tons and immobile neutral defects,
0.1 tomin-
imize the influence of iron content. For hydrous
10
-2
•
]
C
W
depends on how deep a hydrogen atom is trapped
at M-site (Figure 5.9). The deeper the trap is,
the less free protons will be present. Because the
depth of the potential where hydrogen is trapped
at M-site is related to hydrogen solubility (the
deeper the trap, the larger the solubility), it is
expected that wadsleyite has a smaller
•
]
[(2
H
)
M
]
[
H
[
H
≈
10
-4
Garnet
Clinopyroxene
Orthopyroxene
Olivine
Wadsleyite
Ringwoodite
10
-6
Lizardite
Amphibole
Talc
10
-8
•
]
C
W
than
olivine. Consequently, for the same total water
content wadsleyite will have lower electrical con-
ductivity than olivine. Also this model indicates
that the majority of hydrogen-related defect is
the neutral defect, (2
H
)
M
. The model by Pearson
and Bardeen (1949); Debye and Conwell (1954)
is a model for charged impurities. Therefore the
application of this model to hydrogen conduc-
tion in minerals proposed by Yoshino (2010) is
inappropriate. Also if this model for
p
-or
n
- type
semiconductor (with high impurity content) were
to be used, then
σ
[
H
Antigorite
10
-10
10
12
14
16
10
4
/T(K
-1
)
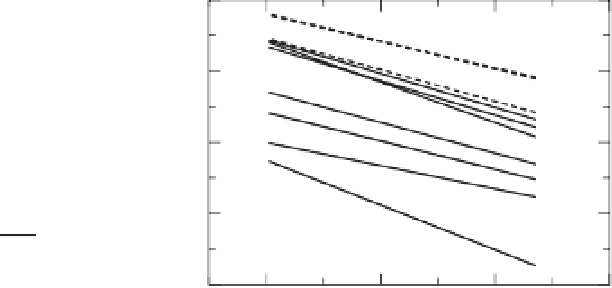
Fig. 5.10
Electrical conductivity of hydrogen-bearing
minerals normalized to 0.01wt % of water (thin solid
lines are nominally anhydrous minerals with
r
0.6-0.7, broken lines are nominally anhydrous
minerals with
r
∼
1 and thick solid lines are hydrous
minerals (results for hydrous minerals are under the
conditions where they are stable. When dehydration
occurs, conductivity will change (see Figure 5.14). Data
from samples with X
Fe
∼
∼
αC
1
/
W
should be used as a concentration dependence
C
1
/
W
exp
RT
1
H
∗
∝
−
−
0.1 are chosen (when the iron
content is different from X
Fe
∼
0.1, corrections are
made using the relation (5.18)). When normalized,
conductivity of hydrous minerals is generally lower
than that in nominally anhydrous minerals showing
that the mobility of hydrogen in hydrous minerals is
less than that in nominally anhydrous minerals. In
these minerals, electrical conduction likely occurs by
some other impurities such as iron-related
mechanisms (therefore their conductivity varies
largely among different minerals). Also the normalized
conductivity of minerals with
r
of electrical conductivity
Yoshino 's group used
−
αC
1
/
W
. Karato and Dai
(2009) showed that the concentration dependence
claimed by Yoshino's group is an artifact of the ex-
perimental technique they used. Also Yang
et al
.
(2011, 2012) found no dependence of activation
energy on water content when impedance spec-
troscopy is used, although they found somewhat
higher values of
r
. In fact our revised calculation
for pyrope also shows a similarly larger
r
(
r
∼
C
W
exp
RT
1
H
∗
σ
∝
−
∼
1 is generally higher
than that of minerals with
r
∼
0.6-0.7. Data are from
Table 5.1 for nominally anhydrous minerals and for
hydrous minerals data are from Reynard
et al
., 2011;
Zhu
et al
., 2001; Schmidbauer
et al
., 2000. Modest
anisotropy is reported for talc (Guo
et al
., 2011). We
used the average values.
1;
Table 5.1). It appears that minerals where dom-
inant hydrogen-bearing species is (
H
·
Al
)
Si
has
r
1, but minerals where dominant hydrogen-
bearing species is (2
H
)
M
has a lower value of
r
.
∼