Geoscience Reference
In-Depth Information
8
7
θ
V
6
5
h
y
olivine-spinel phase boundary
4
3
F
2
660 km discontinuity
1
0
34567
velocity of subduction, cm/y
x
8
9
10
11
z
(a)
(high T)
(low T)
(c)
slab viscosity field
depth (km)
0
140
280
420
570
42.5
0
Effective viscosity
> 10
26
Pas
.. 10
26
Pas
.. 10
25
Pas
.. 10
24
Pas
.. 10
23
Pas
<.. 10
22
Pas
10
25
10
24
10
23
10
24
−
42.5
42.5
0
−
42.5
0
200
400
600
800
x (km)
(b)
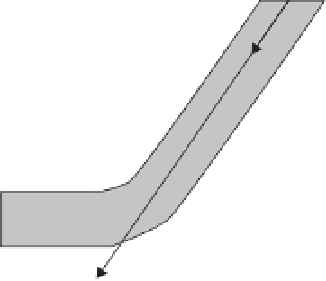
Fig. 4.22
Rheological properties of subducted lithosphere in the upper mantle and the transition zone (after Karato
et al
. (2001). (a) A schematic diagram showing a subducted slab (F is the force causing bending). (b) Viscosity
distribution in subducted slabs (top: a warm slab, bottom: a cold slab). (c) The slab strength (measured by the
flexural viscosity) versus slab temperature relationship (flexural viscosity is defined by 4
h
3
1
/
2
−
x
2
dx
where
h
is the thickness of a slab and
η
is effective viscosity). The resistance for slab bending is characterized by the flexural
viscosity (Karato
et al
., 2001). The slab strength increases with decreasing temperature in the high-temperature
regime, whereas it decreases with decreasing temperature in the low-temperature regime. The former is caused by
normal temperature sensitivity of viscosity while the latter is caused by the anomalous temperature sensitivity of
viscosity caused by the strong temperature sensitivity of grain-size after a phase transformation (see Figure 4.21).
Note that the central portion of a cold slab is weakened by grain-size reduction (Figure 4.22b) that makes slab
deformation possible. However, even after weakening, the flexural viscosity is still high (higher than that at
trenches (
1
/
2
η
(
x
)
·
·
10
37
Nms)) suggesting that the energy dissipation by deep slab deformation may control the rate of
mantle convection. Reproduced with permission of Elsevier.
∼