Geoscience Reference
In-Depth Information
G
1
(MPa)
G
max
. ( for
σ
'
3
= 200 kPa)
Dr
r
alpha
C
1
C
2
τ
y
(kPa)
50
370
165
118
2.4
8
0.09
5.0
60
390
174
118
2.5
7
0.08
4.5
70
410
183
122
2.6
6
0.06
3.0
80
430
192
123
2.7
5
0.05
2.5
100
470
210
129
2.8
4
0.04
1.5
Table 10.5.
Parameter values
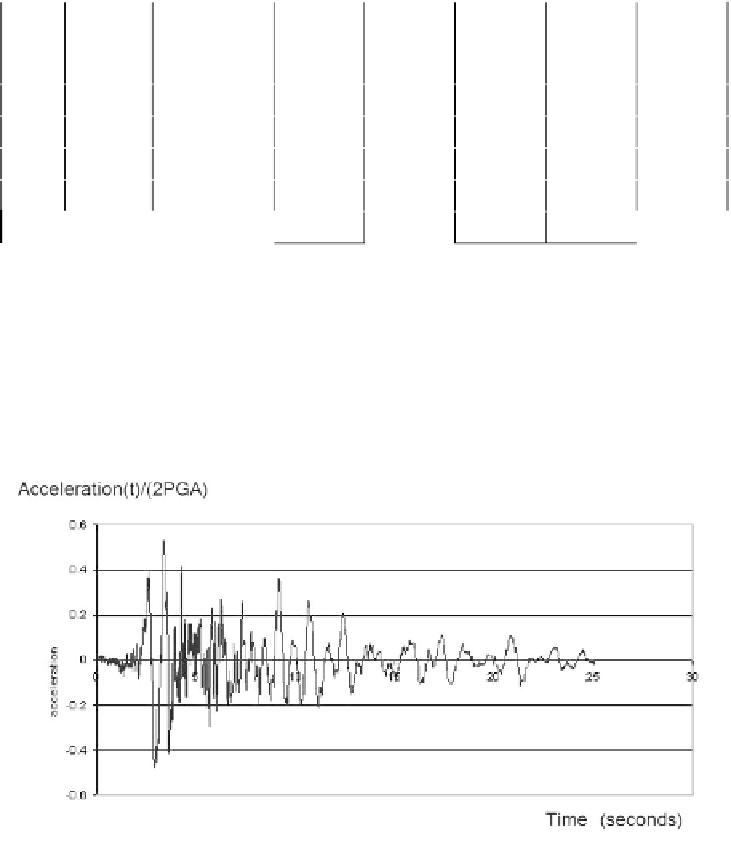
Only one earthquake was considered, given by a horizontal accelerograph
applied at the base of the model, corresponding to a 6.1 magnitude with a focal
distance of 12 km, a damping of 5% and a maximum acceleration
PGA
= 0.25g (see
Figure 10.17).
Figure 10.17.
Chosen accelerograph
The results showing the influence of the relative density are quite interesting.
They demonstrate that a relative density of 50% corresponds to a change in the
embankment behavior.
Table 10.6 gives a comparison between the numerical results and the thresholds
characterizing the seismic resistance, as discussed in the above section.


Search WWH ::

Custom Search