Geoscience Reference
In-Depth Information
-
(a)
6
1
TS40 (Dr=40%) simulation
TS93 (Dr=93%) simulation
5
0.95
0.9
4
0.85
3
0.8
CSL
2
0.75
1
0.7
TS40 (Dr=40%) simulation
TS93 (Dr=93%) simulation
test (Dr=40%)
0
0.65
−1
0
5
10
15
20
1
2
3
4
10
10
10
10
ε
1
(%)
p kPa
(b)
(c)
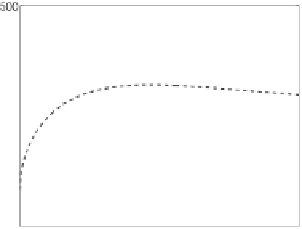
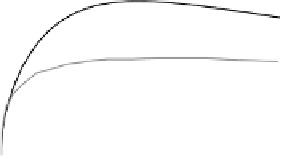
Figure 9.25.
Comparison of triaxial test results of Toyoura sand obtained in the laboratory
(
D
r
= 40%
and
D
r
= 93%
for
p
0
=100 kPa) [FUK 84] and those simulated numerically
with the ECP model: a)
q − ε
1
plane; b)
ε
v
− ε
1
plane; and c) void ratio
e − p
plane
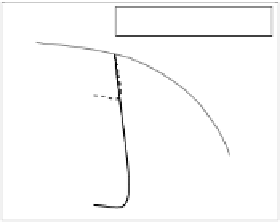
field obtained by a previous calculation step, where the balance of forces between the
pile, soil and interface due to different weights is checked. The strength mobilization in
the shaft and at the base obtained by the numerical model compares very satisfactorily to
those obtained by Fioravante [FIO 02] in the centrifuge testing two different interface
roughnesses (Figure 9.27). The effect of roughness of the interface is very clearly
highlighted. This roughness also affects the displacement of the pile head for which
the maximum shaft strength is reached. This is obtained for
s/d
of about
12 − 15%
when
R
n
=0.45
, whereas it decreases to
2%
for
R
n
=0.01
(see Figure 9.27).
Since measuring tools were placed on the piles, radial and tangential stresses were also
measured at certain points along the pile (
β = τ
s
/σ
v0
). These measures help to clarify


Search WWH ::

Custom Search