Geoscience Reference
In-Depth Information
The set of parameters in Table 7.1, which can be directly determined from the
experimental curves, has the advantage of being commonly used in the soil
mechanics community: elastic stiffness, friction angle, and critical state parameters.
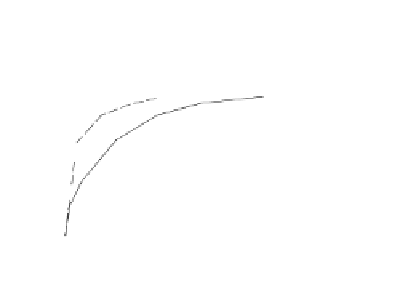
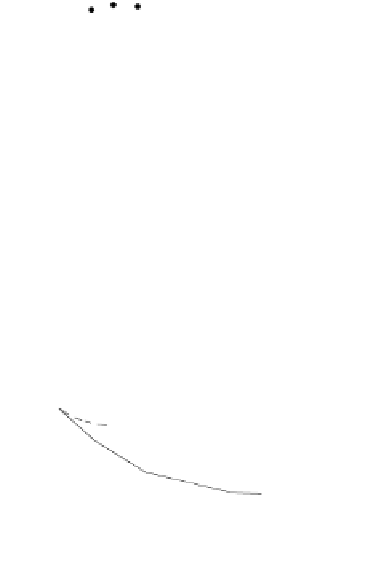
Figure 7.6 presents a set of measured stress−strain behaviors showing the
influence of the initial void ratio. The representation of the curves obtained by
Biarez and Hicher [BIA 08] from a comparison of results on different sands at
different initial void ratios shows the correspondence between the stress−strain
curve and the volumetric change for contractive and dilative materials. Figure 7.7
presents a set of numerical results obtained with the set of parameters from
Table 7.1 with different initial void ratios, corresponding to relative densities
between 0.05 and 1.00. Both stress−strain relations and volume changes are in
agreement with the experimentally measured curves in Figure 7.6, showing the
capability of the model to account for the influence of the initial density of the
granular assembly.
1.5
1.0
0.5
0.0
0
10
2 0
3 0
4 0
ε
1
(%)
12
8
4
0
-4
-8
0
10
2 0
3 0
4 0
ε
1
(%)
Figure 7.6.
Influence of initial density on the behavior
of sand along drained triaxial loading


Search WWH ::

Custom Search