Geoscience Reference
In-Depth Information
600
1
2
Quasi-saturated tests :
η
max
= 1.54
3
6
400
5
4
7
8
9
200
11
10
0
0
200
400
Effective mean stress p' = p+
σ
'
cap
(kPa)
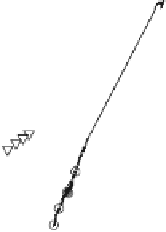
Figure 6.17.
Interpretation of results of large strain triaxial tests using the
micromechanical model for determining effective stress [1: w=3.74%;
2: w=6.25%; 3: w=7.5%; 4: w=8%; 5: w=9.5%; 6: w=10% 7: w=10.4%;
8: w=14.1%; 9: w=16.1%; 10: w= 17.9%; 11: w=18.3%]
6.5.2.
Interpretation of small strain modulus measurements
The normalized values of the modulus for the different tests, shown in Figure
6.15, have been plotted in Figure 6.18 as a function of the effective vertical stress:
σ'
v
= σ
v
+ σ
'
cap
(
p
a
= 0). To interpret the results, the values of the capillary pressure
were derived from correlations based on the measurements made at different water
contents, void ratios, and confining stresses. For quasi-saturated specimens,
σ
'
cap
=
p
a
- p
w
and for dry specimens, σ
'
cap
= 0. For unsaturated specimens, the
values of σ
'
cap
were derived from the micromechanical model, using the same
“characteristic dimension”
R
= 1.7 µm as for the other triaxial tests and the function
shown in Figure 6.16. Expressed against the effective stress, all the results (from
w
= 0% to
w
= 18.3%) are correctly located near the regression line of the dry and
quasi-saturated specimens, with equation
E
v0
= 200 (σ'
v
/
p
atm
)
0.68
[6.25]
Considering that the results were obtained on samples of different sizes, under
very different conditions, with different experimental devices, from values of pore-
water pressure deduced from correlations and for deformations below 10
-5
, the
amount of scatter in the data is rather small.


Search WWH ::

Custom Search