Geoscience Reference
In-Depth Information
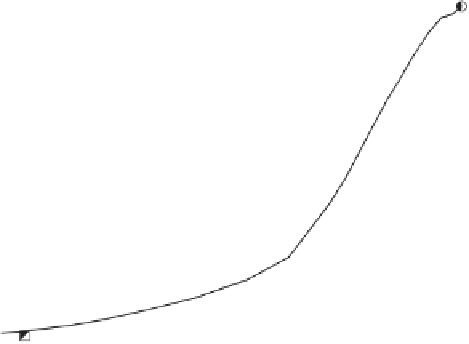
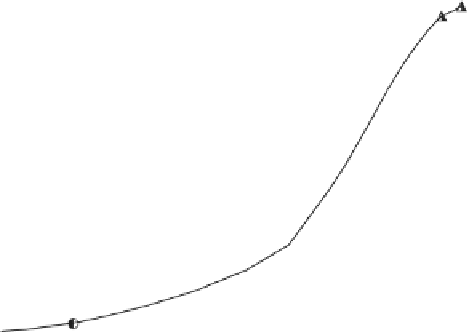
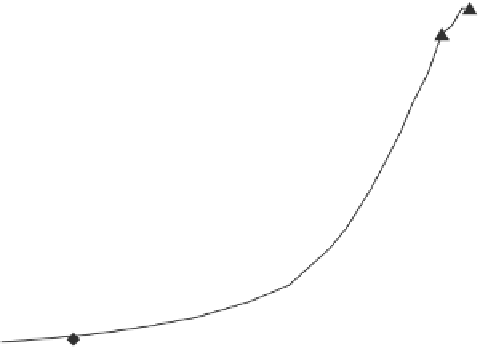
To evaluate this phenomenon, the grain size of the waste rock was systematically
analyzed after each test. The grain size distribution curves of ROM and leached
waste rock, before and after oedometric tests, are shown in Figure 4.5 for the
different vertical stresses applied and summarized in terms of evolution of d
10
and
d
60
. These diameters correspond to the openings of the sieves through which 10%
and 60% in weight of material pass, respectively, in Table 4.3.
For the two grain size distributions of the analyzed waste rock, the results show
that the leached waste rock, with an initial grain size distribution finer than that of
the ROM, presents a stronger grain size evolution. This is probably related to the
effect of forced leaching on the individual strength of the particles.
Percent Passing
# 200
# 4
8"
100
90
ROM WR before testing (< 8")
ROM WR after testing at σ'
v
= 4 MPa
ROM WR after testing at σ'
v
= 8 MPa
ROM WR after testing at σ'
v
= 12 MPa
Leached WR before testing (homothetic)
Leached WR after testing at σ'
v
= 4 MPa
Leached WR after testing at σ'
v
= 8 MPa
Leached WR after testing at σ'
v
= 12 MPa
80
70
60
50
40
30
20
10
0
0.1
1
10
100
Particle Diameter (mm)
Figure 4.5.
Grain size distributions of ROM and leached waste rock (WR) before and after
oedometric tests. Tests performed on large-scale samples
4.4.3.4.
Saturated permeability
Once the samples became saturated under the applied vertical stress, infiltration
tests at a constant hydraulic head were carried out to determine the permeability
coefficient in saturated condition for both ROM and leached waste rock. Low
hydraulic gradients were imposed to induce a laminar infiltration flow in these
materials. The permeability coefficients obtained are presented in Table 4.4.


Search WWH ::

Custom Search