Geoscience Reference
In-Depth Information
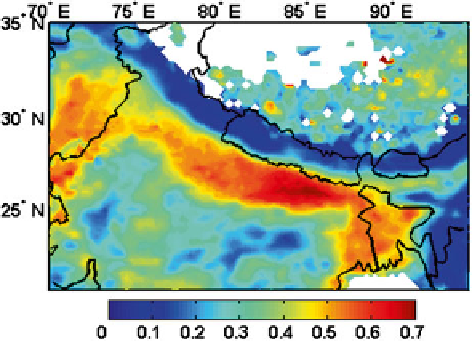
Fig. 3.5
Enhanced
aerosol optical depth over
the Indo-Gangetic plains
during winter season
(December-January)
from Terra/MODIS data
for the period 2000-2005
Level-2 AOD product embedded in the SSF product. CERES SSF data from Terra
were obtained for the 2-month winter period for the period 2000-2005. The spatial
resolution of each CERES SSF pixel is 20 km × 20 km at nadir. The SSF data con-
taining the shortwave TOA fl ux and the collocated AOD were binned onto a 0.25*0.25
uniform grid. Further, the CERES fl ux data were screened for cloud contamination
by using the co-located MODIS cloud cover information in the SSF product.
Figure
3.5
shows the AOD composited for the winter season from 2000 to 2005
from MODIS data, with signifi cantly higher AOD (>0.5) over the IGP (especially
over eastern IGP) suggesting enhanced winter time particulate pollution. The pollu-
tion hotspot over the eastern IGP apparently coincides with the densely populated
regions of north-northeastern India where the surface elevation is also lower com-
pared to that of the entire IGP and is also an area where maximum subsidence
occurs, thus favoring the accumulation of aerosols in the lower boundary layer
(Girolamo et al.
2004
). In addition, the north-northeastern parts of India also house
several high-capacity coal-fi red thermal power plants, which are also a signifi cant
source of aerosol emissions (Prasad et al.
2006
). Previously, chemical transport
model simulations have indicated the presence of higher absorbing aerosol concen-
trations (e.g., black carbon) over the eastern IGP (Gautam et al.
2007
).
Next, the instantaneous shortwave direct aerosol radiative forcing was calculated
based on CERES and MODIS data.
Figure
3.6
shows the shortwave aerosol forcing at TOA. There is a signifi cant
increase in the aerosol forcing in the 0<AOD<0.5 range, suggesting increased aerosol-
induced absorption. A second-order polynomial is used to characterize the observed
TOA aerosol radiative forcing. The aerosol radiative forcing varies from −5.7 W/m
2
to −39.45 W/m
2
in the 0<AOD<0.5 range. At AOD=1, the shortwave forcing is
about −40.7 W/m
2
, which is similar to that at AOD~0.5. Nearly half of the data lie in
the 0.4<AOD<0.6 range, indicating higher aerosol loading. The large instantaneous
aerosol radiative forcing or enhanced aerosol absorption associated with the winter
haze may act to further reduce solar insolation from warming the surface, in turn
amplifying cold conditions at the surface and regional haze occurrence.
Search WWH ::

Custom Search