Geoscience Reference
In-Depth Information
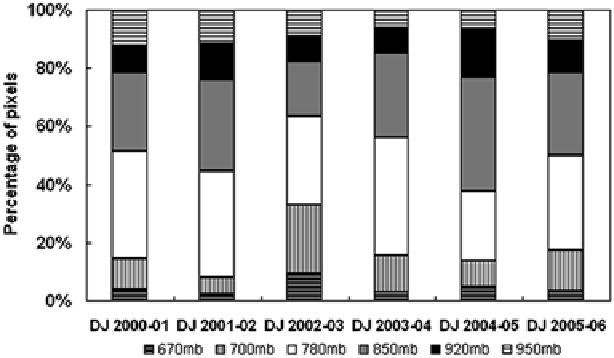
Fig. 3.3
Inter annual variability of percentage of pixels of cloud top pressure in the stacked fog/
low-cloud distribution for each winter year from 2000 to 2006, derived from MODIS data.
Approximately 80 % of the cloud tops are in the vicinity of ~2 km (or lower than 2 km) thus indi-
cating that majority of the clouds are within the boundary layer
signifi cant number of fog/low-cloud occurrences are also found over Pakistan and
Bangladesh on the western and eastern sides, respectively, with about 10 days of fog
occurrences.
Figure
3.2b
shows the fog occurrences identifi ed using surface observations
recorded over 13 locations in the IGP (including Bangladesh) for the 6-year winter
period. The tallest bar indicates ~20 days of fog occurrences. Foggy days repre-
sented by yellow bars are overlaid onto the surface topography. For a given day, fog
is identifi ed using surface observations and by parsing the meteorological SYNOP
code. Ground data for weather conditions and meteorological parameters such as
RH, wind speed/direction, and air temperature were obtained from (
http://meteo.
infospace.ru/wcarch/html/index.sht
)
over 13 stations in the IGP for six winter sea-
sons, DJ 2000-2006. The weather conditions data indicate the number of fog occur-
rences which are available as synoptic codes, ranging from 40 to 49, and foggy
conditions being categorized into different classes. Similar spatial pattern of fog
occurrences from surface observations and fog/low-cloud occurrences from Terra/
MODIS suggest that the MODIS-detected low-cloud may actually be fog with their
base close to surface. Although there exists spatial similarity, a direct comparison
between the number of MODIS-detected fog/low-cloud and ground-observed fog
occurrences may not be appropriate due to the presence of multi-deck clouds and
gaps between satellite overpasses. In addition, some fraction of fog is expected to
burn off at the time of the Terra satellite overpass (10:30 AM local time).
In order to quantify the vertical distribution of the fog layer, statistics of cloud
tops in the 6-year MODIS cloud top pressure data were computed. Figure
3.3
shows
the percentage of pixels with cloud tops at different pressure levels from 670 to
950 mb in the fog/low-cloud occurrences from DJ 2000 to 2006. About 80 % of the
Search WWH ::

Custom Search