Geoscience Reference
In-Depth Information
(a)
(b)
(c)
(d)
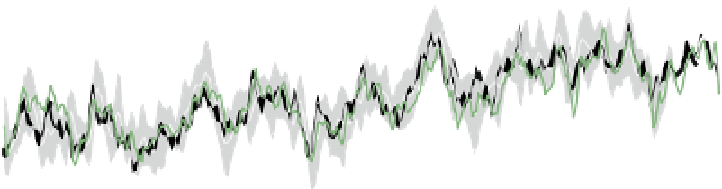
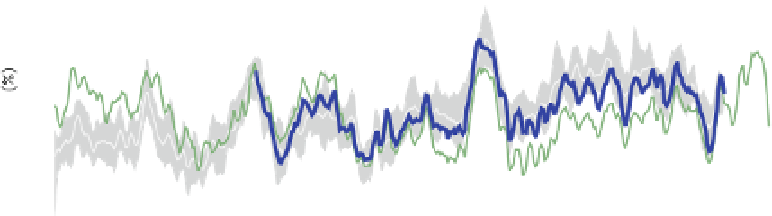
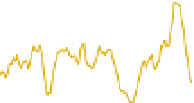
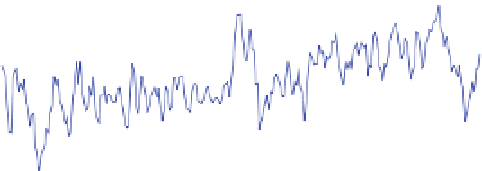
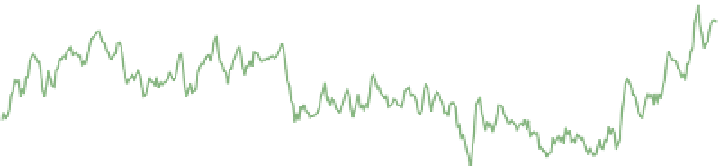
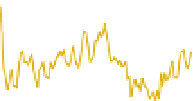
Fig. 4 Deseasonalized anomalies in a surface air temperature, b column integrated water vapor or specific
humidity, c precipitation and d atmospheric net radiative cooling for AMIP5 simulations (±1 inter-model
standard deviation, models 2 and 4-11 in Table
2
) and observationally based estimates. All time series
anomalies are relative to the 1988-1996 base period (models are adjusted relative to the ensemble mean)
apart from SMMR (1983/1984 base period) and Advanced Microwave Scanning Radiometer-EOS (AMSR-
E) (mean adjusted to agree with mean SSM/I W and GPCP P over the period 2003-2008); 3-month averages
of anomalies are plotted. In a, the 95 % uncertainty range is shown for HadCRUT4 observations. In b and c,
the SMMR and SSM/I record uses the satellite microwave record over the 50S-50N oceans and ERA
Interim W or GPCP P data elsewhere. In d, the International Satellite Cloud Climatology Project - Flux
Dataset (ISCCP-FD) atmospheric radiative cooling anomalies are reduced by a factor of 3
Trends documented in Table
3
cover too short a record (1988-2008) to be physically
meaningful yet provide a useful comparison between AMIP5 simulations and observations.
Rapid warming from 1993-2002 (*0.4 K), after the eruption of Mt. Pinatubo in 1991, is
followed by static global mean T; it has been suggested that a shift in ocean circulation
may have contributed to this variability (e.g., Merrifield
2011
; Gu and Adler
2012
). A rise
in W over 1988-2008 of around 1 %/decade from SSM/I-ERA Interim and simulations is
equivalent to *5-6 %/K given the trend in T, slightly lower than anticipated from
Clausius-Clapeyron. Trends in global P (Table
3
) are not statistically significant over the
period,
consistent
with
expectations
from
the
simple
model
in
Sect.
2.1
However,