Geoscience Reference
In-Depth Information
p = 0.90 for the base and test scenario, respectively, and in the Aral region at p & 1,
while the P change in the latter is significant at p = 0.80).
Figure
6
further emphasizes the major differences in water availability between the two
regions, and the importance of this difference for the regional change magnitudes and their
implications from different perspectives on hydro-climatic change. In absolute terms, all
water flux changes are much smaller in the Aral region than in the MRB. Yet, the small
R and associated other water flux changes in the Aral region have led to one of the world's
worst environmental disasters in modern times: the Aral Sea desiccation and associated
ecosystem collapse (Gaybullaev et al.
2012
). Note then that the terminal Aral Sea is
entirely dependent on the runoff R into it from its own endorheic drainage basin; fur-
thermore, R constitutes an internal flux in that total land region, including both the Aral Sea
and its drainage basin, with net total water flux balance P - ET still being negative and
thus imbalanced at the end of the twentieth century (Table
1
), so that the Aral Sea con-
tinued to shrink also after that time. In contrast, R from the MRB into the ocean, which is
not particularly dependent on just that basin discharge into it, is an external flux from the
MRB land system, with a net total water flux balance being P - ET - R, which was in
this region essentially zero and thus balanced at the end as in the beginning of the twentieth
century (Table
1
).
In Fig.
6
, the comparison of results for the MRB from the present, relatively simple
scenario approach and the more complex hydrological modeling (accounting also for
uncertainty in the latter implied by available regional R data listed in Table
1
) indicates the
test scenario as the least extreme of the two simple scenarios with regard to R and water
availability changes in the landscape. However, with regard to T changes, the test scenario
implies a greater cooling effect of irrigation that masks an also greater climate-driven T
change (Fig.
4
).
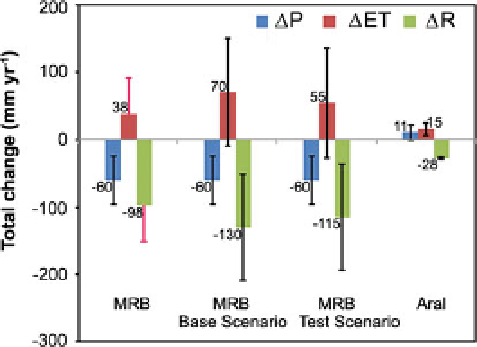
Fig. 6 Water flux changes (for precipitation, DP, evapotranspiration, DET, and runoff, DR) in mm per year
between the same periods as in Fig.
3
for the Mahanadi River Basin (MRB) and the Aral region. The results
for MRB that do not refer to any scenario, and those for the Aral region are from previous distributed
hydrological modeling as listed in Table
1
. The magenta error bars for DR and DET from the previous
distributed hydrological modeling of MRB (left) show the possible error range associated with these results
if considering the available runoff observation data for part of the 1956-2000 instead of the modeled runoff
result for that period (Table
1
); to maintain basin-scale water balance, the DR error range must also be
mirrored as a corresponding DET error range. Black error bars further show 80 % confidence intervals
(
Appendix
, Table 3) for the other DET and DR results, as well as for DP, for both regions