Geoscience Reference
In-Depth Information
(a)
Glacier area (%)
(b)
Glacier regions
Alaska: 13%
Western Canada
& US: 2%
Antarctic &
Subantarctic: 18%
1
12
2
New Zealand: < 1%
11
Low Latitudes
& Southern Andes: 5%
Arctic
Canada: 20%
10
3
9
High Mountain
Asia: 17%
5
4
8
Greenland: 12%
Iceland: 1%
Svalbard
& Scandinavia: 5%
7
Central Europe, Caucasus &
N Asia: < 1%
6
Russian Arctic: 7%
(c)
Glacier volume (%)
(d)
Volume change by 2100
(% of global)
(e)
Volume change by 2100
(% of initial per region)
-24%
-17%
-11%
14%
-14%
-40%
-74%
1
12
-2%
23%
1
12
1
11
-38%
< 1%
< -1%
2
12
2
11
-4%
10
2
10
-26%
3
-49%
9
< 1%
9
11
-10%
10
3
3%
-28%
4
-27%
3
9
8
< -1%
30%
6%
8
5
8
< 1%
7
-85%
5
7
-60%
-13%
8%
4
6
6
7
4
6
5
1%
4%
-8%
-8%
-55%
-46%
8%
-3%
Fig. 1 a Regional glacier area in % relative to the global glacier area of 744,430 km
2
(Gardner et al.
2013
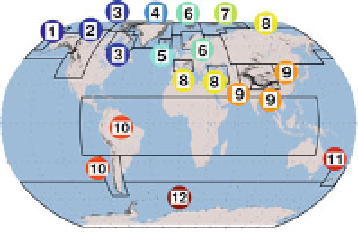
). b 12 glacierized regions containing all the Earth's mountain glaciers and ice caps (Randolph Glacier
Inventory; Arendt et al.
2012
). Some of the 19 primary regions from Randolph Glacier Inventory (black
polygons) are combined here. c Regional glacier volume in % relative to the global glacier volume of
522 mm SLE (Radi´ et al.
2013
). d Regional contribution of glacier volume loss (%) to global volume loss
of 155 mm SLE projected for 2006-2100 as a mean of 14 GCMs with RCP4.5 (Radi
´
et al.
2013
). e Total
regional volume change of glaciers over 2006-2100, expressed in % of initial regional glacier volume, as a
mean projection from 14 GCMs with RCP4.5 (Radi´ et al.
2013
). Here, each region's pie size is proportional
to its regional volume change (therefore the sum over the pie sizes is not 100 %). Numbers in the pies
correspond to the regions in (b)
To account for glacier area changes, most models apply volume-area (or volume-
length) scaling, which states that the volume of a mountain glacier is proportional to its
area (or length) raised to a power (Bahr et al.
1997
). Considering the lack of data required
for higher-order glacier dynamics models, these methods are shown to be a good first-order
approximation of glacier dynamics for the assessments of global-wide and region-wide
glacier mass changes (Radi´ et al.
2007
,
2008
; Adhikari and Marshall
2012
). Though
simple, the approach allows modeling of the tendency of mountain glaciers to reach a new
equilibrium in a warming climate since the specific mass balance (i.e., mass change per
unit area) tends to become less negative as the glacier retreats from low-lying, high-
ablation altitudes.
3.1 Models based on mass-balance sensitivity
Mass-balance sensitivities refer to the changes in mass balance that result from instanta-
neous changes in temperature and precipitation, and are generally estimated from mass-
balance modeling of glaciers with mass-balance observations (e.g., Braithwaite and Zhang
2000
; de Woul and Hock
2005
). In combination with the data on temperature (DT) and
precipitation change (DP), glacier mass change (DM) over a time window (Dt) can be
obtained from