Geoscience Reference
In-Depth Information
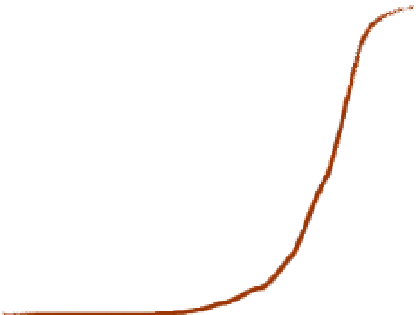
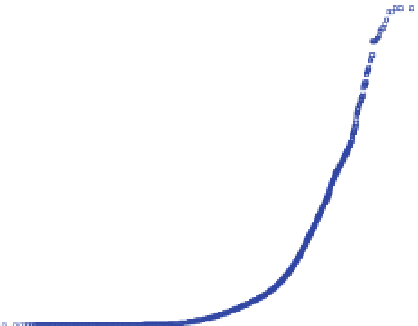
Fig. 7 a The quantiles of the
standardized recovered rain (i.e.,
Z = 300R
1.4
) versus standard
normal quantiles. The rainfall
quantile values are only for the
positive rainy part of the fields
and are standardized by
subtracting the mean and
dividing by the standard
deviation. b Comparison of the
cumulative distribution of rainfall
intensities focusing on extremes.
Both plots show how both the
VarD and SPaD downscaling
methodologies reproduce
extreme rainfall intensities not
present in the observed LR fields
True (high-res.)
14
(a)
SPaD
12
10
8
6
4
VarD
2
0
Obs. (low-res.)
-2
-4
-5
-4
-3
-2
-1
0
1
2
3
4
5
Standard Normal Quantiles
1.01
(b)
1
True (high-res.)
Obs. (low-res.)
SPaD
VarD
0.99
0.98
0.97
0.96
0.95
0
10
20
30
40
50
60
70
R [mm/hr]
blockiness coming from the mismatch between the assumed and true filters. In fact, this
blockiness provides a qualitative diagnostic of the filter mismatch, in that it picks up the
fact that the underlying true observation filter (the Gaussian in this case) was smoother than
the one used for recovery. Apart from the visual inspection of the downscaled field, Fig.
9
(caption) provides the comparison metrics that show the underperformance of this
downscaled field relatively to the one obtained using the correct filter (compare values with
those in Table
1
). The possibility of developing a methodology to learn properties (e.g.,
smoothness and nonlinearity) of the underlying observation filter in the case that no
coincidental LR and HR data sets are available to apply the dictionary-based methodology
is appealing and warrants further exploration.