Geoscience Reference
In-Depth Information
high-resoluton Observation
low-resolution Observation
(a)
(b)
dBZ
50
40
30
20
10
0
dim: [50, 70] range: [0, 45]
dim: [400, 560] range: [0, 50]
VarD
SPaD
(c)
(d)
dim: [400, 560] range: [0, 52]
dim: [400, 560] range: [0, 51]
45
(e)
True (high-res.)
Observed (low-res.)
V
Ds
SPaD
40
35
30
25
20
15
10
5
220
240
260
280
300
320
340
360
380
400
Section A-A [km]
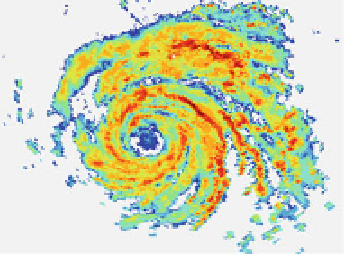
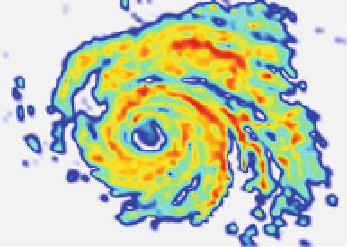
Fig. 5 a Original HR base reflectivity snapshot at resolution 1 9 1 km over TX (hurricane Claudette,
08-16-2003, UTC 11:51:00); b The synthetic LR observation obtained by coarse graining of the field up to
scale 8 9 8 km (smoothing with an average filter of size 8 9 8 followed by downsampling by a factor 8);
c result of the downscaled field at resolution 1 9 1 km using the variational downscaling (VarD) method;
and d results of the dictionary-based sparse precipitation downscaling (SPaD) method at resolution
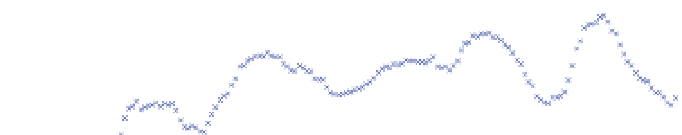
1 9 1 km; e intensities averaged over a bandwidth of 8 km centered at a cross section A-A in (a), displaying
the true HR field, the LR coarse-grained field (observations), and the two downscaled fields
downscaling the 8 9 8 km field to 1 9 1 km resolution using the VarD and SPaD
methodologies with ku0
:
05 L
T
H
T
R
1
y
1
in the original formulation of the problem
(11), where
kk
1
¼
max x
j ;
...
;
x
jð Þ
. Note that in all of our experiments, we empirically
found that 0\k
0
:
10 L
T
H
T
R
1
y
1
works well for rainfall downscaling in both