Geoscience Reference
In-Depth Information
Comparison of SMOS SSS (10 day, 100 9 100 km
2
Table 2
average) values, in pss, collocated with a
total of N Argo upper depth measurements
Mean (DSSS)
Std (DSSS)
N
Subtropical Atlantic Ocean (15-30N; 45-30W)
-0.13
0.28
206
Tropical Pacific Ocean (5-15N; 180-110W)
-0.23
0.35
692
Southern Indian Ocean (40-30S; 70-90E)
0.04
0.39
114
Southern Pacific Ocean (50-40S; 180-100W)
-0.08
0.51
467
DSSS = SSS
smos
- SSS
argo
Only SMOS ascending orbits are considered. Std (DSSS) primarily reflects the
decreasing signal to noise ratio with decreasing SST. Note that subtropical Atlantic Ocean and tropical
Pacific Ocean have similar SST
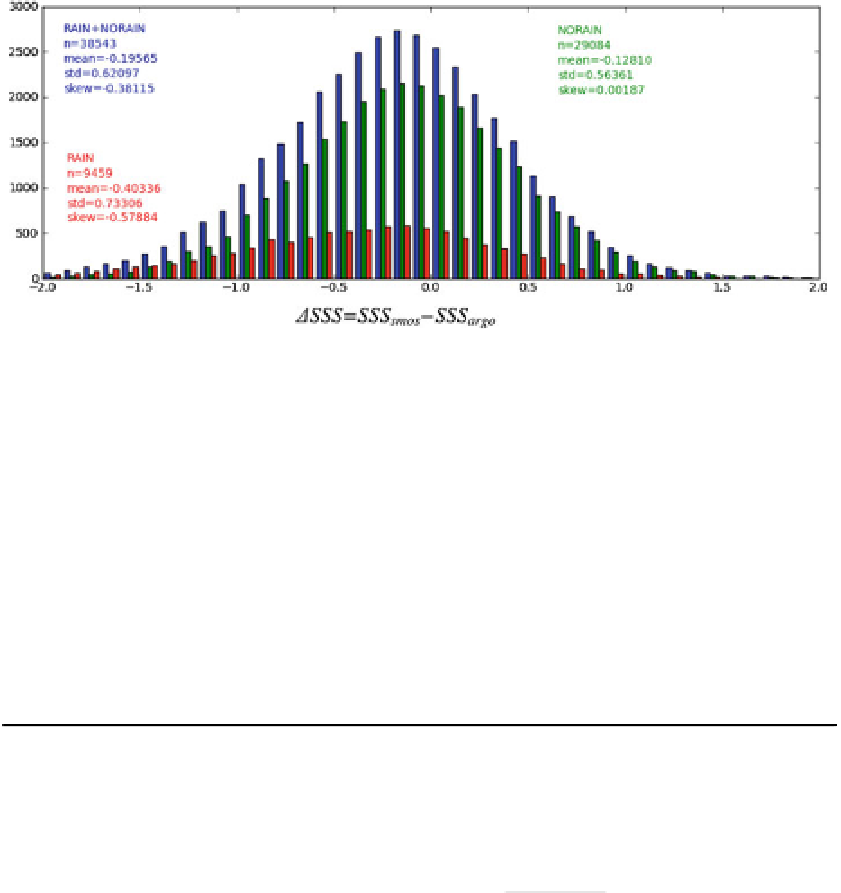
Fig. 15 Statistical distribution of SSS differences DSSS = SSS
smos
- SSS
argo
in the tropical Pacific Ocean
for various sorting on colocated SSSM/I rain rates. Blue: all collocations (without any rain sorting); green:
for non-rainy cases (SSM/I rain rates less than 0.1 mm h
-1
); red: rainy cases (SSM/I rain rates larger than
0.1 mm h
-1
). Corresponding statistics are indicated in Table
3
Table 3 Statistics for the SSS differences DSSS = SSS
smos
- SSS
argo
as a function of rain rate (RR) in the
northern tropical Pacific Ocean
Mean
(DSSS)
Std
(DSSS)
Skew
(DSSS)
N
(DSSS)
Tropical Pacific (5-15N; 110-180W)
All colocations
-0.20
0.62
-0.38
38,543
No rain (RR \ 0.1 mm h
-1
)
-0.13
0.56
0.01
29,084
Rainy (RR C 0.1 mm h
-1
)
-0.40
0.73
-0.58
9,459
Atlantic based upon the SSS and SST relationship in the ocean mixed layer (OML). The
salt conservation budget in the OML with depth h can be expressed as follows (Michel
et al.
2007
;Yu
2010
,
2011
):
oS
ot
¼
ð
E
P
R
Þ
S
~r
S
C
ð
w
e
Þ
w
e
ð
S
S
h
Þ
h
þ
k
r
2
S
ð
1
Þ
h
where S is the surface salinity, t is time, E and P the evaporation and precipitation rates,
respectively, R the freshwater input by river runoffs, h the mixed layer depth,
~
the
(vertically averaged) current vector within the OML, and w
e
the vertical entrainment rate.