Geoscience Reference
In-Depth Information
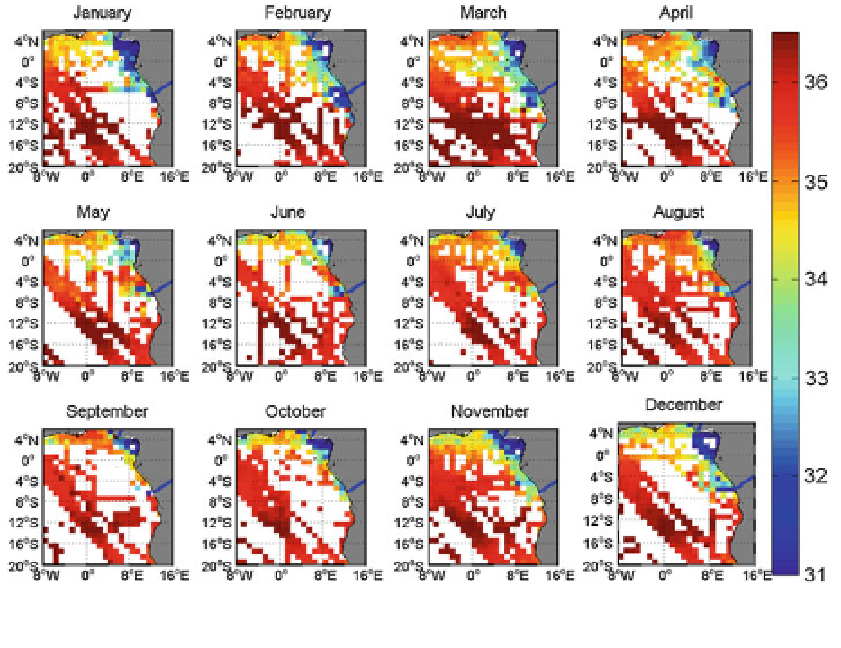
Fig. 9 Maps of the monthly averaged SSS in the ETA derived from the ensemble of in situ measurements
collected during the period 1977-2002 and used to build up Reverdin et al. (
2007
) climatology
around April), however, lag by approximately 4 months the maxima in the river discharge
at Brazaville station (found around December-January). These lags probably indicate the
time for the freshwater masses to be transported from Brazaville to the river mouth and
then to be further advected by surface currents far offshore. However, the interannual
variability in the amplitude of the seasonal cycle of SSS and river discharge are not
correlated. While the river discharge reached significantly different minimum values of
*3.3 9 10
4
m
3
/s and *2.3 9 10
4
m
3
/s in 2010 and 2011, respectively, the maxima in the
averaged SSS are constantly found at *35.5 pss. Similarly, the maximum discharge level
of *5.8 9 10
4
m
3
/s measured over the period is found in January 2012, while the mini-
mum in the averaged SSS (*31.9) occurred in April 2011.
While understanding the observed satellite SSS trend in that region is still an under-
going activity, combining satellite information on surface currents, SST, rain rates and SSS
together with river discharge levels will certainly help in the near future to better quantify
the sources of variability in the local hydrological cycle of the Gulf of Guinea. The
terrestrial and atmospheric hydrological fluxes in this region also act as a dominant
modulator of the local fishery. The regular SMOS SSS data can therefore help to better
understand the mechanisms involved in the biophysical interplay and its relevance for the
fishery with potentially significant socioeconomic impact in that region.
In addition, similarly to the Amazon-Orinoco River plumes, conservative mixing laws
for bio-optical properties of the major river plume in the ETA region can now be sys-
tematically studied using SMOS data as shown in Fig.
12
. Examples of the conservative
mixing linear laws for the CDOM coefficient deduced only from space-borne measure-
ments are shown for year 2010 around the Congo and Niger rivers.