Geoscience Reference
In-Depth Information
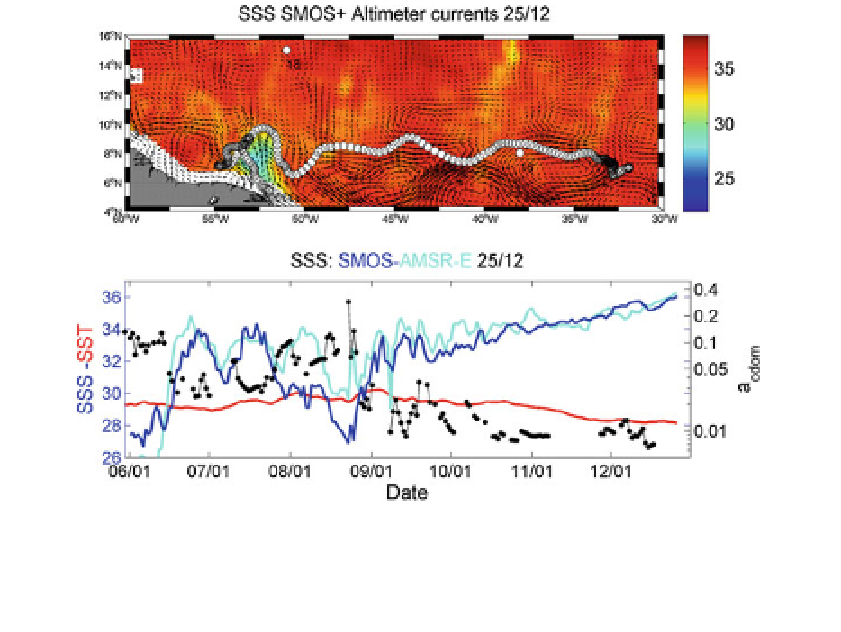
Fig. 4 Top: spatiotemporal evolution of the location of an hypothetical drifter (white dots) dropped at 52W
6N at the beginning of June 2010 and advected with surface currents estimated from altimetry and surface
winds (arrows). Superimposed are the ±5 days averaged daily SSS fields from SMOS and the surface
currents (black arrows). Bottom: time series of the colocalized SSS from SMOS (blue) and from AMSR-E
(cyan), the analyzed SST (red), and the merged daily CDOM (black) along the drifter path
substances begins to dominate the attenuation of light in surface waters. Del Vecchio and
Subramaniam (
2004
) studied such conditions in the Amazon plume and characterized the
relative contributions of CDOM, particulate organic material, and phytoplankton to the
total absorption field. In the coastal ocean adjacent to river sources, CDOM tends to behave
as a freshwater tracer, decreasing away from the river source with increasing salinity.
Linear correlations between CDOM and salinity in river plume waters are well docu-
mented in the ocean color literature with reported relationships robust enough to allow
salinity retrievals from CDOM and vice versa (e.g., Ferrari and Dowell
1998
; Palacios
et al.
2009
; D'Sa et al.
2002
; Conmy et al.
2009
).
Linearity in the CDOM-salinity relationship implies conservative mixing dominated by
two distinct endmembers. Departures from linearity can occur when additional water
masses are present (Blough and Del Vecchio
2002
), or by in situ subsidies of CDOM
released via net phytoplankton growth (Yamashita and Tanoue
2004
; Twardowski and
Donaghay
2001
), microbial utilization (e.g., Moran et al.
1999
; Obernosterer and Herndl
2000
), or photochemical oxidation (e.g., Miller and Zepp
1995
).
Based upon preliminary satellite microwave SSS data from AMSR-E sensor and ocean
color products, Salisbury et al. (
2011
) recently demonstrated the spatial coherence between
surface salinity and the absorption coefficient of CDOM at 443 nm in the Amazon and
Orinoco river plume-influenced waters. Given the new SMOS data, the spatial and tem-
poral coherence between SSS and optical properties of the river plumes, e.g., CDOM, can
now be systematically analyzed.
As illustrated in Fig.
5
, the amplitude of the annual cycle of the Amazon River dis-
charge peaks in June-July and was apparently more important in 2010 and 2011 compared
to the averaged ''climatological'' cycle since 1968. In comparison, the discharge from
Orinoco is much lower and peaks in September. Based upon the Amazon River discharge