Geoscience Reference
In-Depth Information
of the Amazon and Orinoco River plumes can be revealed with historical in situ surface
salinity data. However, only satellite remote sensing data are known to provide means to
monitor the wide surface dispersal of these two fresh pools, with ocean color data being the
first to illustrate Amazon plume reach to well beyond 1,000 km (Muller-Karger et al.
1988
). Since these first observations, the application of ocean color, altimetry, and SST
satellite mapping in this region has increased in its sophistication, showing the ability to
track surface plume area (e.g., Hu et al.
2004
; Molleri et al.
2010
), fronts along the shelf to
the northwest (Baklouti et al.
2007
), and northward propagating eddies or waves shed near
the North Brazil Current (NBC) retro reflection region, the so-called NBC rings (Ffield
2005
; Goni and Johns
2001
; Garzoli et al.
2004
). In each case, the satellite data are able to
provide time-resolved information on advective processes up to certain limits that include
cloud cover, minor SST and ocean color gradients, non-conservative dilution processes for
the ocean color to salinity conversions (Salisbury et al.
2011
), and baroclinicity and
subgrid variability of the altimetry sea surface height anomaly tracking of the NBC rings.
As first evidenced by Reul et al.
2009
, passive remote sensing data at low microwave
frequencies can be successively used to complement these more ''classical'' satellite
observations to better follow the temporal evolution and spatial distribution of surface
salinity within and adjacent to the Amazon River plume.
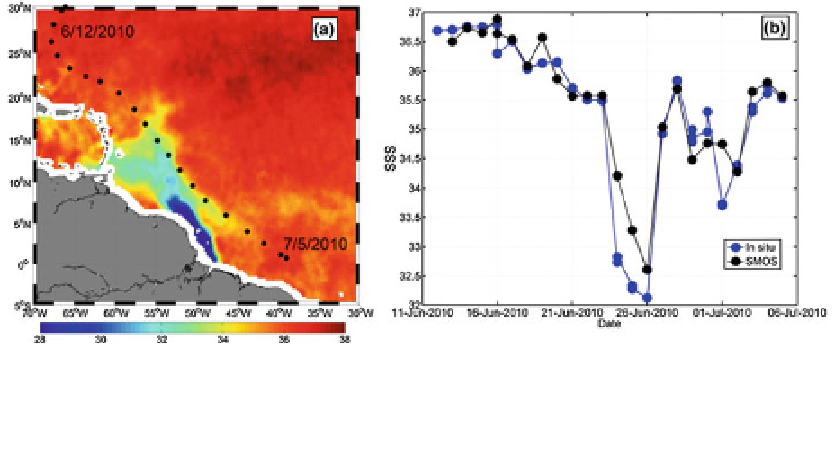
To illustrate this new capability, we first show in Fig.
2
comparisons between collocated
SMOS SSS and in situ conductivity-temperature-depth (CTD) measurements acquired
during the Geotraces West Atlantic cruise leg 2 across the Amazon River plume in June
2010. This campaign was conducted on RV Pelagia in the frame of the GEOTRACES
international program (see
http://www.geotraces.org/
)
.
Comparison between satellite and 3-m depth in situ SSS data reveals an overall good
agreement with a standard deviation of the difference SSS
SMOS
-SSS
CTD
of *0.45. In
particular, the strong gradient and *3-unit drop observed as the R/V Pelagia leg crossed
the Amazon River plume is well detected by the satellite observations.
New SSS products from satellite platforms such as SMOS allow in particular to gain
insights into the advection pathways of the freshwater Amazon and Orinoco rivers plume
along surface currents. For the first time, SMOS sampling capability thus enables imaging
the plume structure almost every 3 days with a spatial resolution of about 40 km.
Fig. 2 a Black dots: location of the CTD stations conducted during the Geotraces West Atlantic cruise leg 2
(RV Pelagia) from 11 June to 5 July superimposed on the SMOS averaged SSS from June 12 to July 5, 2010.
b Colocated surface salinity between SMOS and in situ data along the leg. SMOS data have been averaged
at 50-km resolution with a ±5-day running temporal window