Geoscience Reference
In-Depth Information
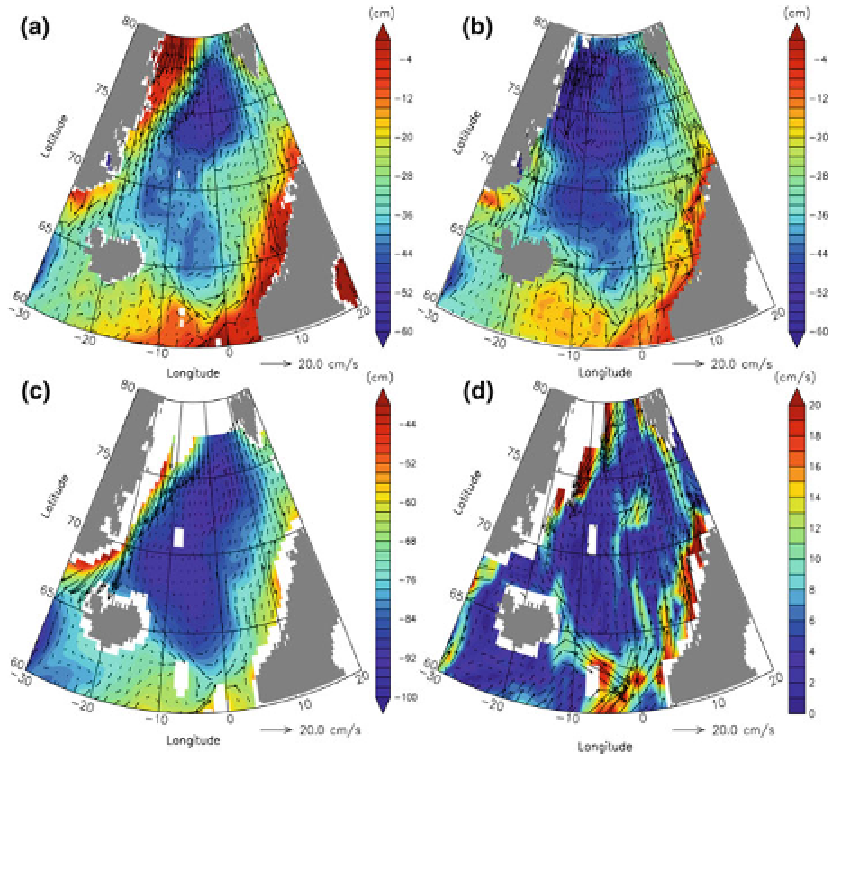
Fig. 7 Mean surface geostrophic velocities shown by vectors superimposed on corresponding mean
dynamic topography (MDT) derived from a GOCE, b CNES_CLS09, c Maximenko et al. (
2009
), and
d mean surface velocity vectors derived from the climatology of the global surface drifter data. Color scale
indicates the MDT in cm for (a)to(c) and speed in cm/s for (d). Current-vector scale shown in the lower
right corner
and Skagseth (
2010
); Orvik and Skagseth (
2003
,
2005
); Skagseth et al. (
2008
); and Orvik
et al. (
2001
) as documented in Table
2
, taking into account the slight differences in the
integration periods. On the other hand, the total combined GOCE-based and hydrographic
transport estimates across the Svinøy section is about 35 % larger than other reported
findings (e.g., 6.9 vs. 5.1 Sv).
In comparison, the mean (1993-2007) transports estimated from the three models across
these sections show quite different values as noticed in Table
2
. One explanation for this is
partly related to the definition and choice of layers for the transport estimations. For
instance, Sandø et al. (
2012
) defines the Atlantic Water (AW) as water in model layers
above the pycnocline (sigma_2 \ 36.9 kg m
-3
), which is representative of the interface
between inflowing and outflowing waters throughout the integration. In contrast, Berx et al.
(
2013
) simply uses T[3 C as definition for the AW in their calculation of the transport of
AW across the IFR section. The best agreement between the model and the combined
GOCE-based and hydrographic data is clearly obtained for the ATL simulation with
transport estimates across the IFR and FSC of 3.5 and 4.2 Sv, respectively.