Geoscience Reference
In-Depth Information
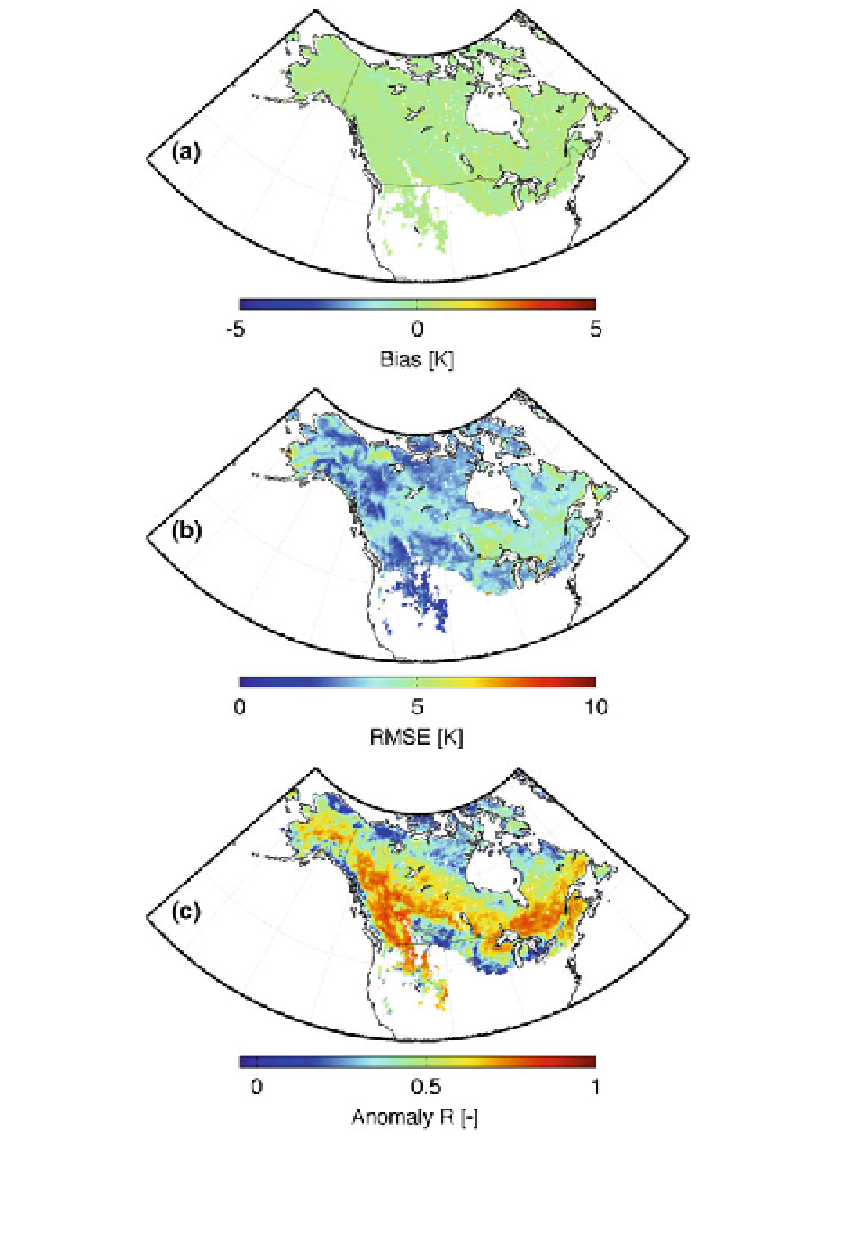
Fig. 8 a Bias, b RMSE, and c anomaly R for ANN simulated 10 GHz V-polarized Tb from September 1,
2002 to September 1, 2011 versus AMSR-E observations not used in training. Anomaly R values not
statistically different from zero at the 95 % significance level based on a Fisher Z transform are shown in
gray. Such non-significant R values occur in only a few very small regions
in retrieval algorithms (Kelly
2009
). For the demonstration of the radiance-based assim-
ilation considered here, observations of DTb imply that the resulting Kalman gain is
proportional to error correlations between modeled SWE and ANN predictions of DTb. To