Geoscience Reference
In-Depth Information
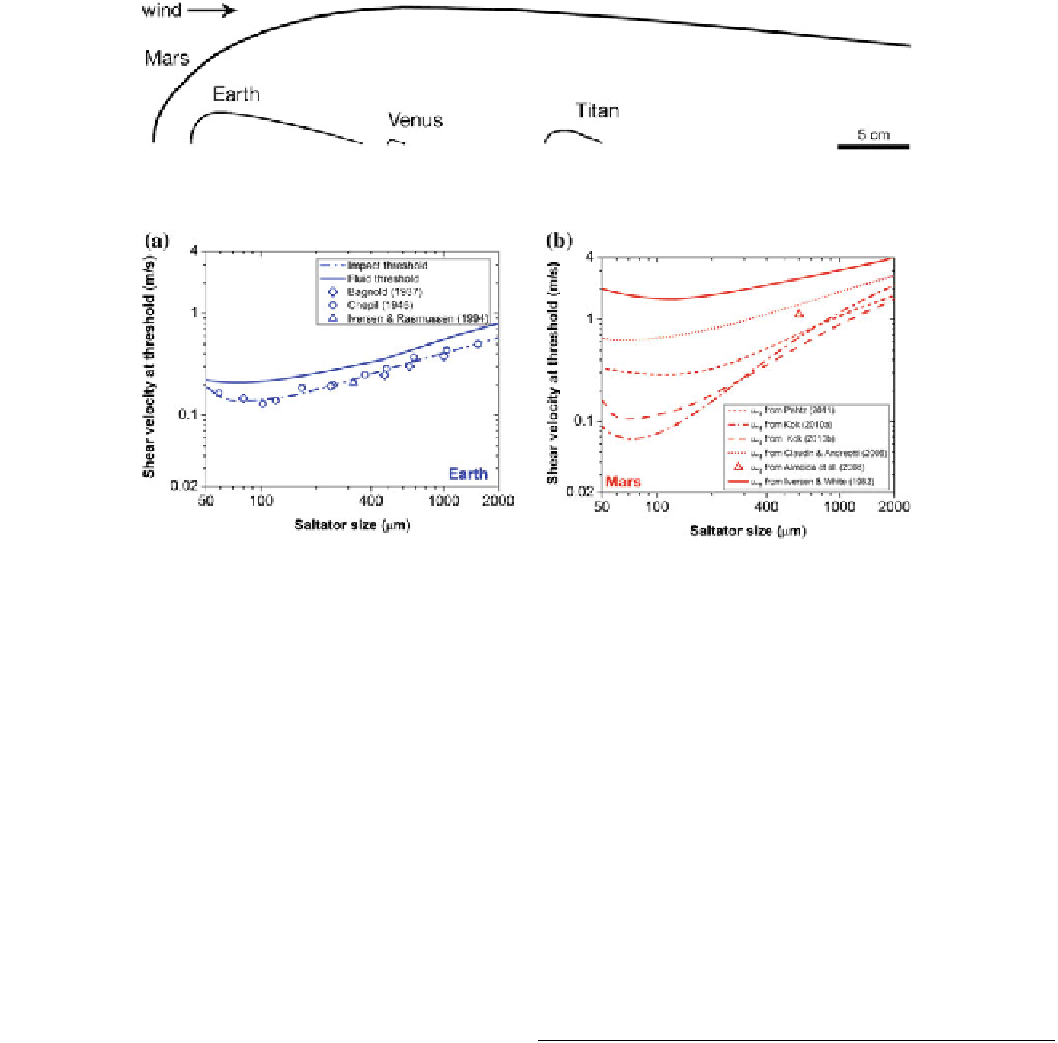
Fig. 4.12
Schematic of typical saltation trajectories and scales on Venus, Earth, and Mars
Fig. 4.13
Fluid saltation thresholds (solid lines) on Earth and Mars.
The dash-dot lines show the so-called impact threshold, the friction
speed at which saltation can be sustained if it starts. For Earth (left),
experimental data (symbols) support the idea that the effective
(impact) threshold is about 20 % lower than the classic fluid threshold.
For Mars (right), however, the impact threshold is a factor of several
lower than the fluid threshold, perhaps explaining why bedforms are
widespread on Mars. Note that for Venus and Titan (not shown) the
impact threshold is higher than the fluid threshold, and is therefore not
of interest. From Kok et al. (2012), with permission
motion (Fig.
4.14
). Before the sand begins to move, the
wind reaches zero velocity at height z
o
, which is the
roughness height (corresponding, in his opinion, to 1/30 of
the mean height of natural surface irregularities, rather than
the size of an individual sand grain). However, after salta-
tion is well established, the wind velocity profiles has a new
focus point that corresponds to a height much higher than k,
and also a non-zero wind velocity. Bagnold called the new
focus point z' (which he inferred to be somehow related to
the height of ripples moving along the surface) and the
velocity at that point V
t
, the threshold velocity as measured
at height z'. The wind velocity u at any height z above the
ground during sand-driving can then be expressed in a
modified version of Eq.
4.1
:
Bagnold's measurements, both in the wind tunnel and in the
field,
showed
roughness
heights
of
z
o
= 0.002 cm
and
z
0
= 0.3 cm for sand 0.25 mm in diameter.
Clearly, since the boundary layer affects saltating sand,
and the saltating sand affects the boundary layer, simple
algebraic models are challenged to make predictions in
planetary environments. However, simulation tools (see
Chap. 18
) such as multiphase Computational Fluid
Dynamics (CFD) are now able to model the processes
accurately (e.g., Almeida et al. 2009) so considerable pro-
gress can be expected.
4.7
The Saturation Length and Controls
on Dune Size
u
=
u
¼
1
=
K log z
=
z
0
ð
Þþ
V
t
ð
4
:
7
Þ
One consequence of the drag on the wind induced by sand-
driving associated with saltation is to provide a way to
estimate the minimum horizontal scale of a sand dune on
Earth. Bagnold (1941) determined that the growth of the
drag effect on the wind induced by saltation required from 6
to 7 m, measured from where saltation starts, for the drag
effect to become fully developed, or if one fits an expo-
nential curve, that the saltation responds over a length scale
of L
sat
= 2.3 m. He made measurements of where sand was
either added or removed from various segments within his
The drag induced on the wind by the saltating particles
thus alters the lower part of the boundary layer, but once
above the new dynamic roughness height k' the wind once
again follows its normal logarithmic behavior. An inter-
esting attribute of this situation is that no matter how hard
the wind blows, the boundary layer is modified so that the
wind always decreases to a velocity of V
t
at height k'.
Saltation thus establishes a new minimum height above
which the wind can exert its influence on the surface.
Search WWH ::

Custom Search