Geoscience Reference
In-Depth Information
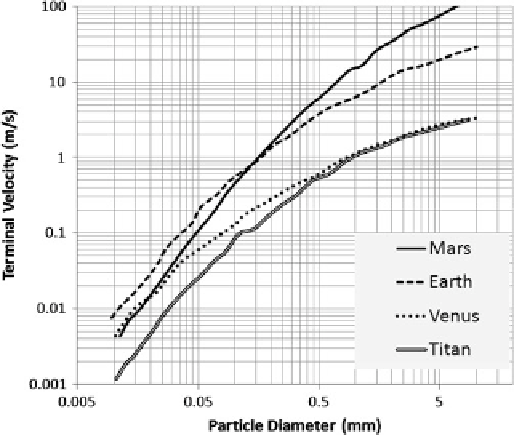
Fig. 4.5
Terminal velocity of particles in air on different bodies. The
curves have slightly different slopes because of the varying roles of
viscosity versus density. In the high-Reynolds number limit, the
largest particles fall faster on Mars since the air is very thin and
density is dominant; Venus and Titan with thickest atmospheres tie for
slowest fall (Titan's weak gravity making up for the fact that its air is
thinner than Venus). However, at the small particle end (low Reynolds
numbers) the ordering changes
freestream value is termed the (velocity) boundary layer
(not to be confused with the planetary boundary layer, or
the thermal boundary layer of heated surfaces). Usually the
wind profile can be approximated by a function of height
referred to as the Prandlt-von Karman equation or, more
commonly, 'the Law of the Wall'.
u
=
u
¼
1
=
K
speed measurement (or simulation) with the corresponding
height as a subscript, e.g., U
10
is the windspeed at 10 m.
The roughness length is related to, but is not exactly
equal to, the typical scale of roughness elements. Field
measurements (e.g., Greeley et al. 1991b) have shown that
the aerodynamic roughness length correlates with the
roughness that one might infer from radar backscatter
wind tunnels and in the field is a very important determinant
for how effectively the wind can cause work to be done
upon a natural surface, and when sand on the natural surface
can be set into motion by the wind. It is also important for
correcting
ð
Þ
ln z
=
z
o
ð
Þ
ð
4
:
4
Þ
where u is the wind velocity at height z, z
o
is the aerody-
namic roughness length of the surface, u
*
is the shear
velocity (or friction velocity) of the wind, and K is the von
Karman constant, which is *0.4. This logarithmic velocity
profile is a consequence of friction on the wind flow caused
by the rough surface. The aerodynamic roughness length z
o
is defined as the height at which the wind velocity reaches 0
on a semi-log plot of velocity above the surface (Fig.
4.6
).
In principle, this line can be defined by two points, but it is
the general (and good) practice to use at least three, to judge
how good a line fit really is.
This profile is why it is standard practice to record wind
measurements at a standard 'anemometer' height, typically
10 m. Corrections need to be applied to measurements
made closer to the ground. It is often the case in field
measurements, and usually the case on planetary landers,
that non-ideal measurements must be made, closer to the
ground than the meteorological standard. Global Circulation
Models (GCM) may report friction speed, or sometimes
only the windspeed in their lowest grid cell, which could be
100 m up or higher. It is good practice to report any wind
wind
measurements
at
low
and/or
different
heights
to
allow
them
to
be
intercompared,
using (for
example) the Prandtl-von Karman equation.
The somewhat rocky Viking 2 lander site on Mars has a
roughness length estimated at *1 cm, while the Mars
Pathfinder landing site (an alluvial outflow area chosen
precisely because there would be rocks!) had z
o
*3cm
(Sullivan et al. 2000). The rather rock-free permafrost sur-
face visited by the Phoenix lander at 68N had a roughness
estimated at 5*6 mm (Holstein-Rathlou et al. 2010).
Smooth playa surfaces on Earth can have sub-mm rough-
ness lengths.
This logarithmic wind profile isn't quite the full story,
however. One can see that as the speed falls near the surface,
the local Reynolds number will also decrease. When this
approaches unity, viscosity will take over and damps out
turbulent fluctuations altogether, forming a viscous sublayer
Search WWH ::

Custom Search