Geoscience Reference
In-Depth Information
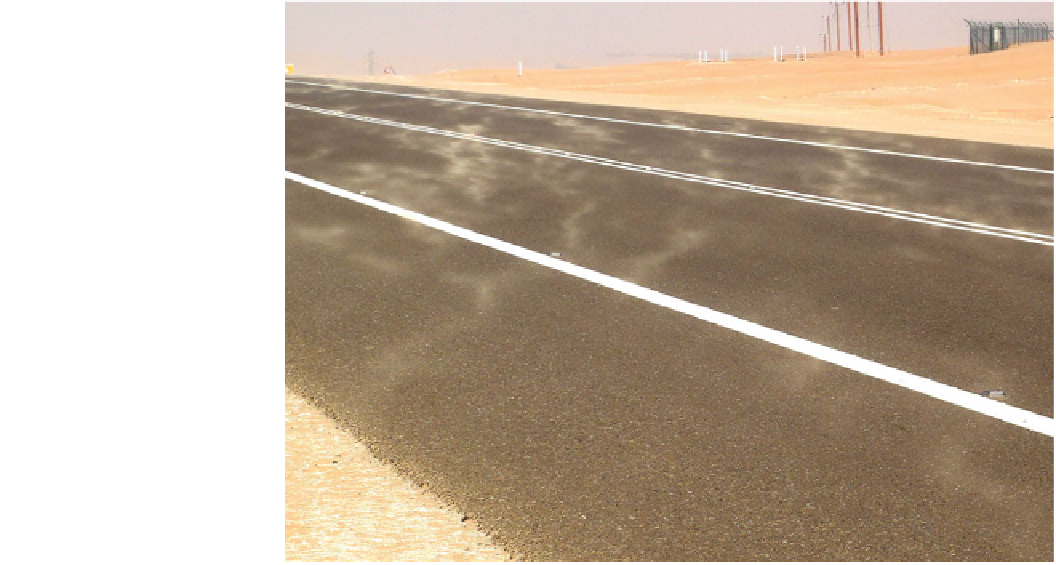
Fig. 3.13
Aeolian streamers—
concentrations of saltating sand.
These are snaking towards the
camera, and are rendered visible
by their contrast against the dark
road. They arise from the
turbulent structure of the air
itself, coupled with the hysteresis
in sand transport (see also
Fig.
12.13
). Similar structures are
often visible in snow. Photo R.
Lorenz, United Arab Emirates
during the late morning and early afternoon to 30-40 %.
Clearly, when considering a threshold phenomenon such as
saltation, turbulence is very important. Obviously, mea-
suring turbulent fluctuations requires instrumentation (see
Sect. 16.3
)
with a very fast response time, and so ultrasonic
or hot-wire anemometers are typically used, with the former
particularly suitable for measuring 2- or 3D winds.
These fluctuating components have power spectra that
portray how much variation occurs at different length scales
as energy cascades down from the large-scale flow through
ever-smaller eddies to the molecular scale where the kinetic
energy is dissipated by viscosity into heat. The spectrum of
turbulence was studied significantly by the Soviet mathe-
matician Kolmogorov, who found that a power law with an
exponent of (-5/3) describes the typical scale variation in
free air. In free air, the variations are often similar in all
directions, so-called isotropic turbulence.
At a flow boundary, such as the surface of a planet
modifies the spectrum somewhat, and of course significantly
influences the directionality of turbulent components of flow
(which cannot cross the boundary). The turbulent flows are
usually discussed in terms of in which quadrant of a plot of
(u', v') they appear. A sweep, which introduces a fast flow
down into the surface (v' negative, u' positive) will apply a
strong shear to the surface, and thus may be effective at
initiating surface particle movement. Flows away from the
surface (u' negative—ejection, and u' positive 'outward
interaction') may help bring particles away from the surface
and into the stronger flow U at higher z.
Spatial and temporal correlations often exist due to
dominant scales in the eddy spectrum, presumably related to
the size of obstacles or to the size of the boundary or fric-
tion layers. These persistent flow structures can sometimes
be rendered visible by moving sand. The most obvious is
the formation of aeolian streamers (Fig.
3.13
), somewhat
regularly-spaced streaks that can often be seen as light snow
blows across a dark road. Some examples of aeolian
streamers in sand at a coastal dune are described with a
width of 0.2 m and spacing of *1 m (Baas and Sherman
2005).
Thus a full description (if anything like one even exists)
of a turbulent flow must invoke the spatial and temporal
variations in velocity, at a range of different scales, and
must recognize that next to a boundary like the ground these
variations will also depend on direction. We nonetheless
hope we have at least made the reader a little literate in
turbulence, and that at least part of the wind's turbulent
character can be measured and quantified.
Search WWH ::

Custom Search