Geoscience Reference
In-Depth Information
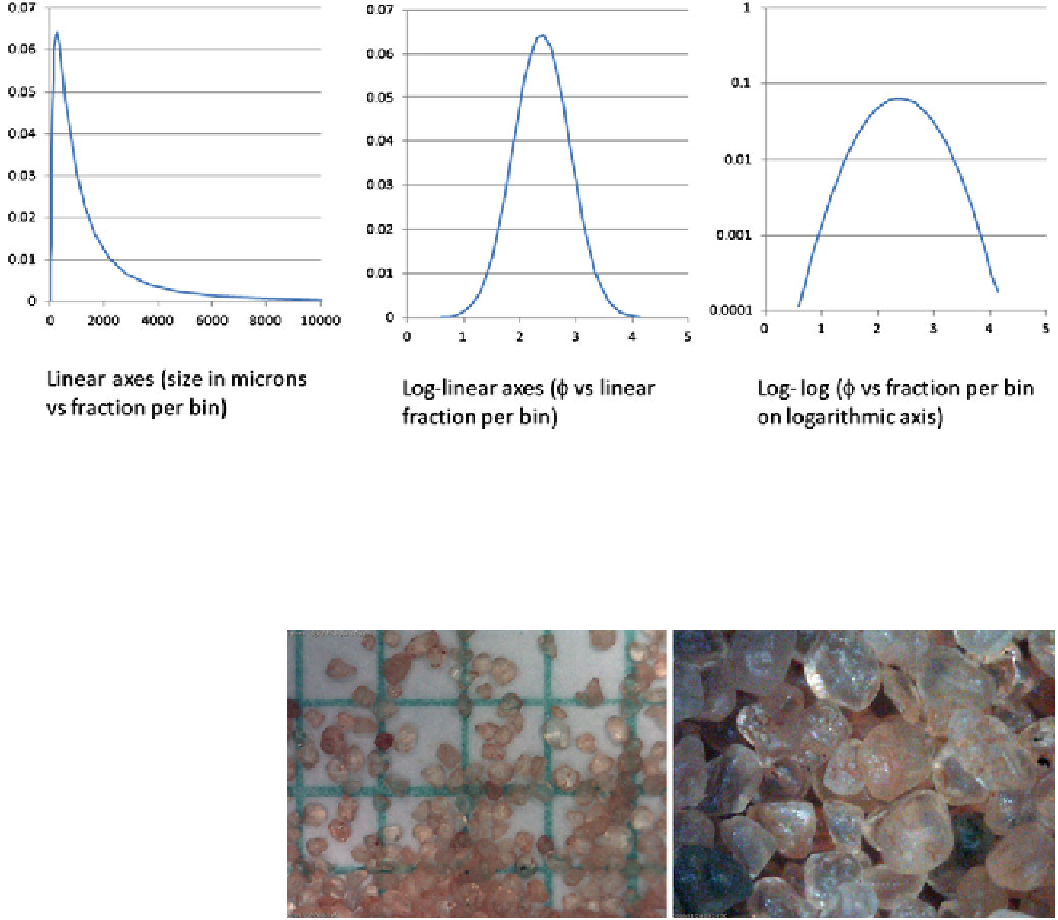
Fig. 2.3
Lies, damn lies, and statistics. These three graphs show
exactly the same (synthetic) data, notionally a log-normal size
distribution of sand. The extreme skewness of the distribution is
evident in the leftmost (linear) plot, which loses detail at the small-
particle end of the plot. That problem is restored by using a
logarithmic size axis (one could simply use a logarithmic axis label,
easy to do in a modern plotting program, or transform the size into a
logarithmic measure such as f). This presentation makes it difficult to
see quantitatively the abundance at the tails of the distribution, to
which Bagnold noted some clarity could be brought by using a
logarithmic ordinate. Some other aspects of chartmanship are high-
lighted in
Chap. 10
Fig. 2.4
Microscopic images of
sand. These are of sand from
coral pink sand dunes in southern
Utah, low res, high res; grid is
1 mm. Photo J. Zimbelman
imaging makes it now rather easy to measure the number,
size and shape of sand grains optically (Fig.
2.4
), and this
has now become almost routine at Mars (Fig.
2.5
).
There is more than one definition of particle size (e.g.,
the cube root of volume may be different from the largest or
smallest dimension). But size is not the only aspect of a
sand particle's dimensions that are of interest. For example,
a rod-shaped grain can pass through a sieve opening that is
smaller than its longest dimension if it happens to encounter
the sieve in just the right orientation. Clearly, additional
descriptive terms were needed to categorize sand grains
derived from diverse source rocks and environments. Sci-
entists struggled to determine the most utilitarian methods
for categorizing sand beyond that of a sieve-derived mea-
sure of its size. The shape of the particle is an attribute that
is related to the particle as a whole; it encompasses the
three-dimensional aspects of the entire grain. Once sand
was routinely observed through a microscope, various
shape-related terms were used to describe the grains, among
which descriptors such as spherical, cylindrical, tabular,
blade-like, or sheet-like came into common usage. Early on,
there was little consensus on how best to measure or
quantify the shape of sand grains. At a finer scale, the
microscope also revealed that the grains varied greatly in
the smoothness or roughness of their surfaces, to which
various modifiers could be added, such as well-rounded or
poorly rounded (Fig.
2.6
). By 1940, the basic definitions
were in place for describing various attributes of grains, but
a variety of methods were explored to quantify and measure
these different properties (Siever 1998).
Search WWH ::

Custom Search