Geoscience Reference
In-Depth Information
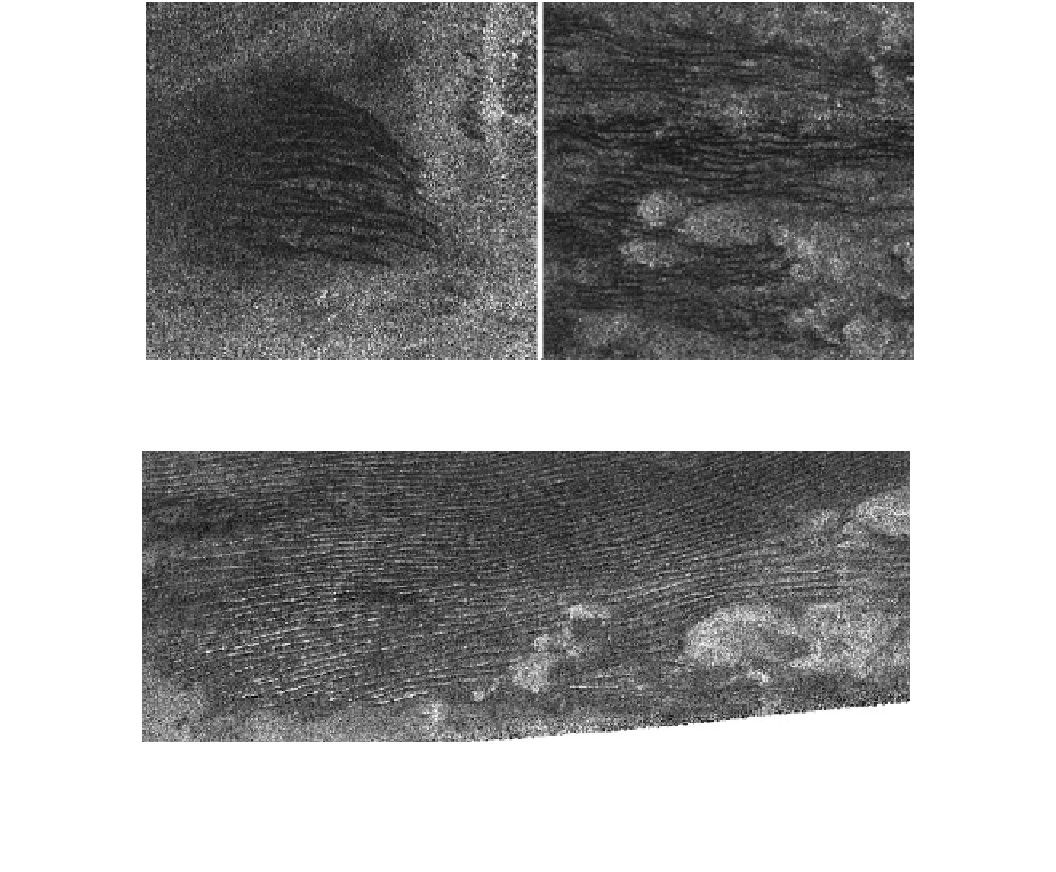
Fig. 13.3
Two segments (about 100 km 9 100 km) of the T3 Cassini radar image, showing dark features now known to be linear dunes ('cat
scratches'). Credit NASA/JPL/R. Lorenz/Cassini Radar Team
Fig. 13.4
The 'smoking gun'. This part of the radar image from T8,
100 km 9 300 km, with radar illumination from above (north) shows
very regular spaced dark features, with glints on their north faces,
confirming their positive relief—their length, height and spacing (and
appearance overall) were noted to be very similar to the linear dunes in
the Namib desert. Their streamline-like arrangement with respect to
the bright hills at the right supported an association with a wind or
liquid flow, although some scientists maintained that an erosive origin
should still be considered. Credit NASA/JPL/R. Lorenz/Cassini Radar
Team
in T8 the topographic shape of the sand surface was the
major control on the radar appearance. Second, the equa-
torial groundtrack of the spacecraft meant that the dunes,
oriented E-W, were illuminated broadside-on, giving many
opportunities to detect topographic glints (Fig.
13.4
). These
showed clearly the nature of the dunes as positive relief, and
radarclinometry (Fig.
13.6
) was used to show that the dunes
attained 100-150 m in height: notably, the dunes were the
same height, spacing and morphology as those in the
Namib. Finally, in this dark region, the dunes themselves
seem to have been larger (higher) than in T3, presumably as
a result of a more abundant sand supply.
It was argued that ridges could be erosive in origin (i.e.,
yardangs), rather than depositional, but the presence of
Y-junctions appeared to exclude that possibility. The
arrangement of the dunes around bright and elevated obsta-
cles suggested they followed a flow or streamline pattern
(Fig.
13.7
), making them longitudinal dunes (i.e., 'linear').
The dramatic implication of the observation (T8 covered
about a million square kilometers, or 1 % of Titan's sur-
face) was that, by analogy, all the large equatorial dark
areas were covered with dunes—seas of sand! Radebaugh
et al. (2008) document further study of the dunes with radar
data, counting several thousand individual dunes. Some
network dunes are noted, suggesting complex wind regimes
in specific locations, but predominantly the dunes are linear.
The presence of dunes in the T8 swath, which also
imaged the Huygens landing site, was in fact instrumental in
being able to co-register the 2 cm radar image with the
near-IR image taken by the Huygens probe's camera (e.g.,
Lunine et al. 2008). These different data did not always
correlate well, especially at the small scale, but two dunes
(seen only in the distance as horizontal dark streaks in the
DISR side-looking images, as well as in the radar) were just
visible, and provided the main tie-points to match up the
radar and near-IR data.
Search WWH ::

Custom Search