Geoscience Reference
In-Depth Information
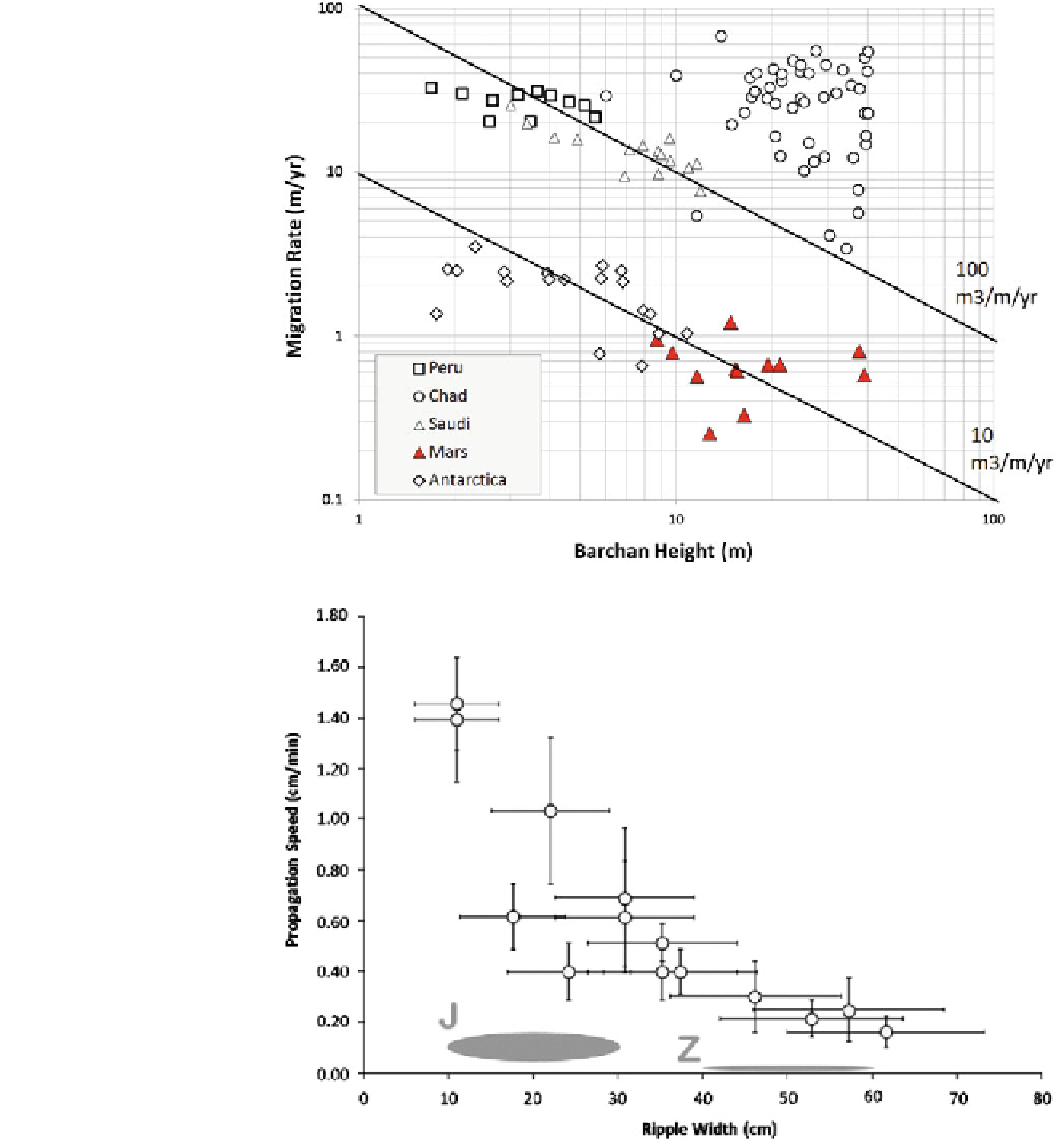
Fig. 9.8
Dune migration rates
from a variety of locations
(compare with Figs.
9.6
and
9.3
).
The most extreme movements are
seen in the low-density sands of
the Bodele depression in Chad,
while rather slow movement is
documented for dunes in the
Victoria Valley of Antarctica.
These slow movements have now
also been documented at Mars
(Bridges et al. 2012b)
Fig. 9.9
Circles with error bars
denote ripple migration rates
measured in the field from
imaging obtained with a
timelapse camera at Great Sand
Dunes National Park and
Preserve (Lorenz and Valdez
2011)
rate of 40 m/kyr, or 0.04 m/year (not too different from the
*0.1 m/year inferred from palm tree burial).
It is important to note that the sand flux will not be
perfectly uniform across a dune field, or even across a single
dune. Nor, for that matter, does the sand flux implied by a
barchan slip face advance capture the entire sand flux, since
some sand 'leaks out' of the barchan horns and some may
even be launched from the brink in high winds fast enough
to escape the slipface. These losses are balanced by the flux
of sand intercepted by the stoss margin of the barchan.
Similarly (see next section) ripple migration may capture
even less of the sand flux. Nonetheless, the migration flux
will usually be dominant, and is useful enough for cross-
scale comparisons (see Fig.
9.6
).
Search WWH ::

Custom Search