Geoscience Reference
In-Depth Information
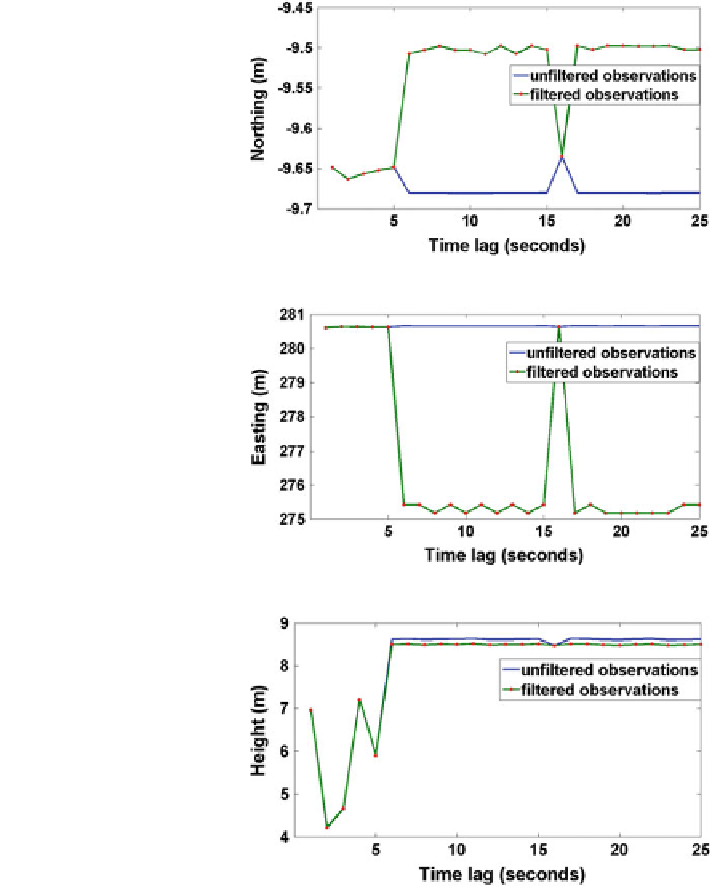
Fig. 7 Filtered and
unfiltered observations for
Northing components
Fig. 8 Filtered and
unfiltered observations for
Easting components
Fig. 9 Filtered and
unfiltered observations for
Height components
(Fig.
13
), the autocorrelation functions take the value Ro = 0.003 and decrease
exponentially until at time lag 300 s when the autocorrelation of the observations
is not so obvious. In the correlogram of Height (Fig.
14
), the autocorrelation
functions take the value Ro = 0.003 and decrease exponentially until at time lag
200 s when the autocorrelation of the observations is not so obvious. These
deviations show that the GPS measurements contain white and coloured noises.
The coloured noises in the GPS measurements follow the exponential distribution.
When the time lag is larger, for example 200 s, the autocorrelation of the