Geoscience Reference
In-Depth Information
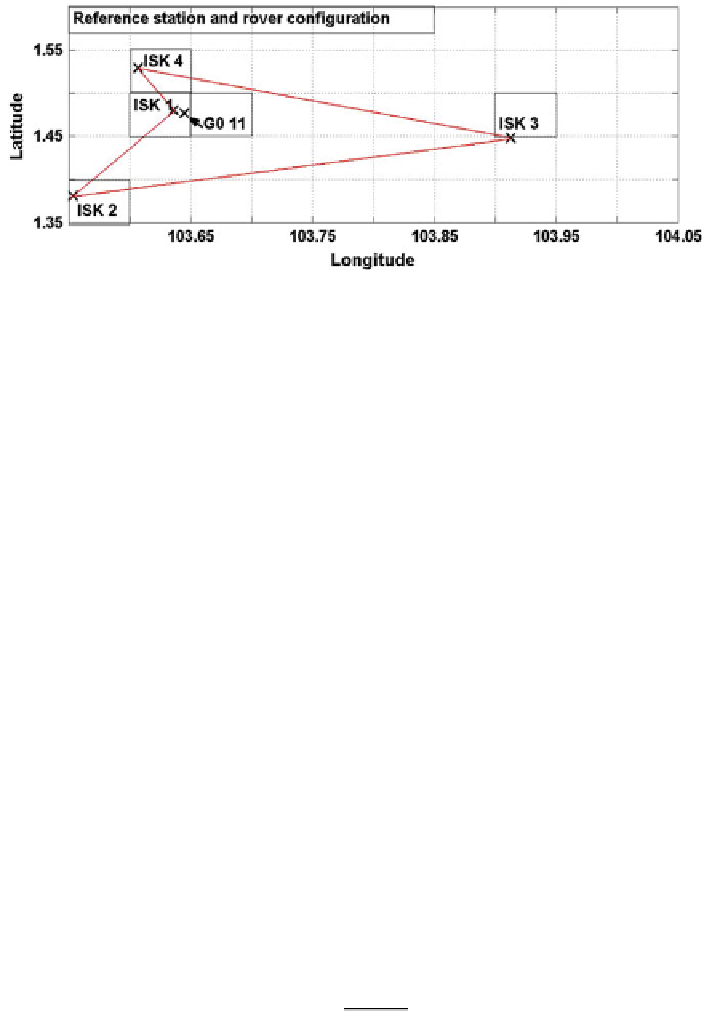
Fig. 6 Test network consisting of four reference stations (ISK1, ISK2, ISK3 and ISK4) and one
rover (GO11)
The processing of the real-time GPS data was performed using the modified
RTKLIB software package, based on server-based processing methodology. In this
approach, the rover station was processed using the single-base RTK technique
from the closest reference station. The reference station used for the data streaming
at G011 was ISK 3, a distance of about 23 km apart. In the next test campaign, all
the reference stations will be utilized in processing the rover position. The results
of the baselines solutions are presented in the local cartesian coordinates.
The baseline of about 23 km may have introduced distance-related errors into
the observations. Also, the high latency rate caused by fluctuations in Internet
service in the streaming of data to the control centre, may have contributed to
delay in ambiguity resolution for the determination of the position solution. In
order to detect outliers in the observations, a high pass filter was implemented. In
this study, a weighted mean value is calculated from the coordinates and sigma
according to Eq. (
1
) (Sundström
2009
):
X
f
¼ X
X
; ð
1
Þ
where X
f
is the filtered position, X is the observed value and X is the weighted
mean value obtained from:
X
¼
X
N
i¼1
X
i
:
w
i
;
ð
2
Þ
where N is the total number of observations for the filter and w is the weight
obtained from Eq. (
3
):
r
3
P
j¼1
w
i
¼
;
ð
3
Þ
r
3
where r is sigma (the standard deviation values of Easting, Northing and Height).
The autocorrelation of GPS time series was also investigated. The observation
time series is described as (Y
1
, Y
2
, Y
3
, …, Y
k
, …Y
n
), which are made at equidistant