Geoscience Reference
In-Depth Information
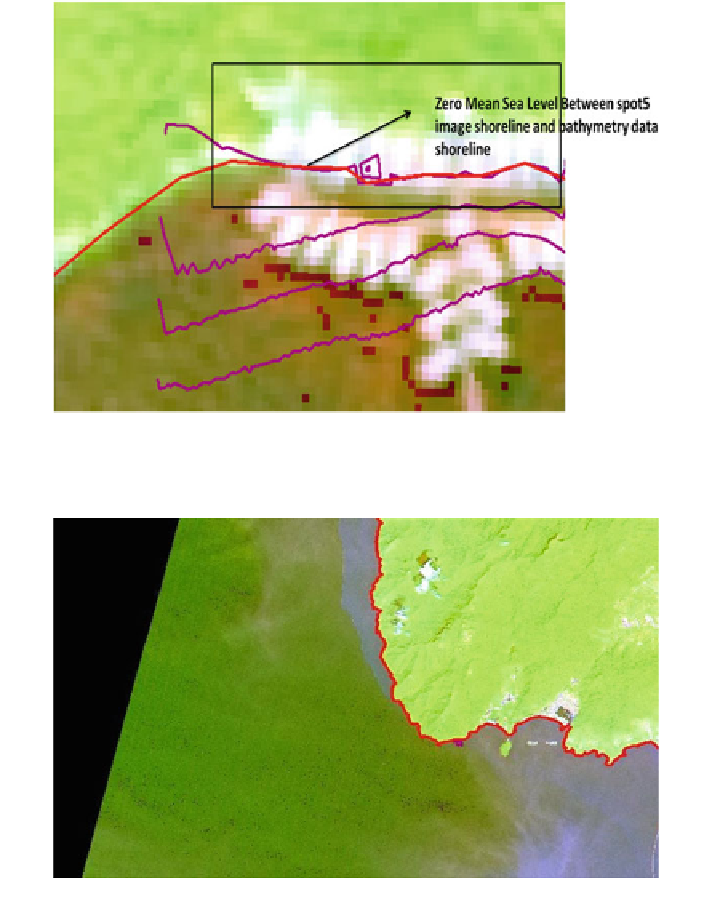
Fig. 8
Zero elevation from line bathymetry and Spot5 maps
Fig. 9
Shoreline model part of Pulau Langkawi
bathymetry and Spot5 maps while Fig.
9
shows the shoreline model part of Pulau
Langkawi. Figure
10
shows the littoral boundaries (LAT and HAT) as defined by
bathymetric and topographic LIDAR.