Geoscience Reference
In-Depth Information
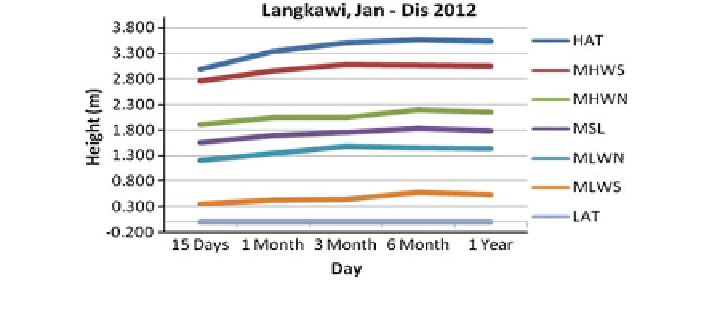
Table 3
Tidal datum value for Langkawi
15 Days (m)
1 Month (m)
3 Months (m)
6 Months (m)
1 Year (m)
HAT
2.991
3.335
3.506
3.570
3.542
MHWS
2.760
2.950
3.078
3.068
3.047
MHWN
1.909
2.048
2.042
2.191
2.151
MSL
1.555
1.692
1.761
1.823
1.790
MLWN
1.201
1.337
1.481
1.456
1.429
MLWS
0.350
0.435
0.445
0.579
0.533
Fig. 3
The graph of water level values from year 2012
Table 4 Every 5 years of analysis
Year of analysis
Year
5 Years
1993-1997
5 Years
1998-2002
5 Years
2003-2007
5 Years
2008-2012
Table 5
Value of water levels (m)
1993-1997 (m)
1998-2002 (m)
2003-2007 (m)
2008-2012 (m)
HAT
3.591
3.535
3.556
3.512
MHWS
3.095
3.024
3.026
3.067
MHWN
2.202
2.137
2.131
2.175
MSL
1.820
1.795
1.805
1.799
MLWN
1.438
1.453
1.479
1.424
MLWS
0.545
0.565
0.584
0.532