Geoscience Reference
In-Depth Information
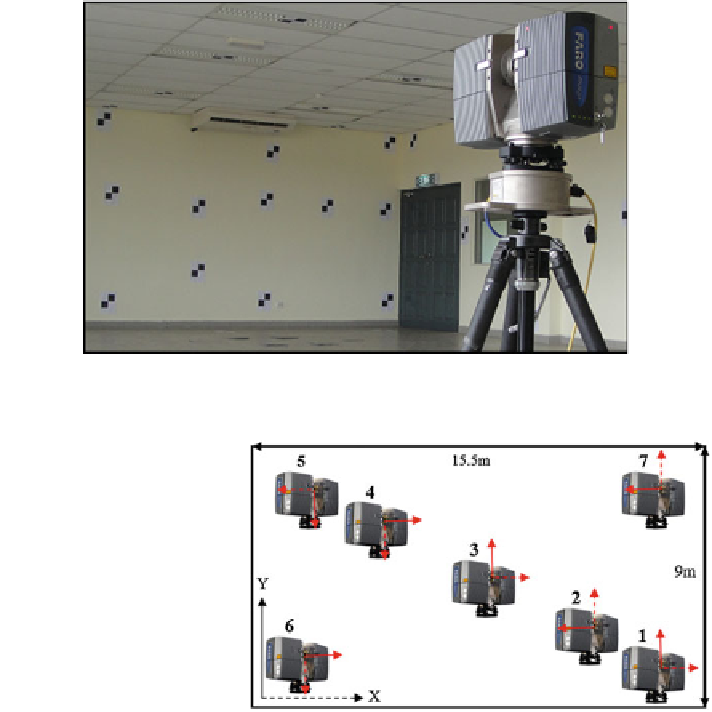
Fig. 11
Self-calibration for the Faro Photon 120 scanner
Fig. 12 Scanner locations
during self-calibration
the vectors produced from both TLS raw and calibrated data, the accuracies can be
calculated and statistically analysed. Results obtained were graphically and sta-
tistically presented to evaluate the significance of self-calibration for the TLS
measurement.
6 Results and Analyses
Using a calibrated digital camera Sony DSC F828 and Photomodeler V5.0 soft-
ware, 15 accurate test points were successfully captured. Results obtained have
indicated that the average precision for all test points are below than 1 mm and
root mean square (RMS) of residuals are less than 0.5 pixel. Size for each pixel is
equal to 0.0027 mm, which means that maximum RMS residuals, is only
0.0014 mm. To finalise the accuracy achieved for all test points, comparison have