Geoscience Reference
In-Depth Information
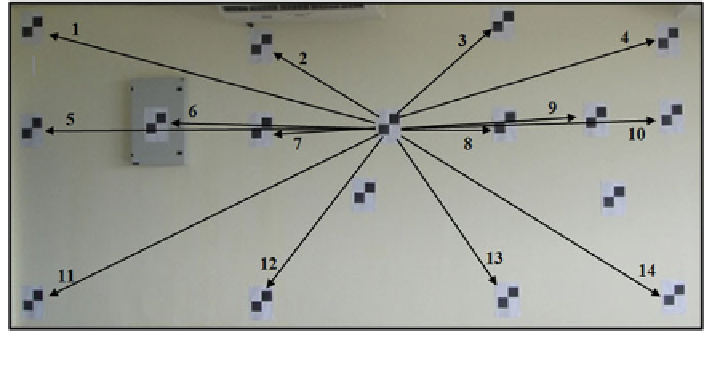
Fig. 10
Fourteen independent vectors generated from test points
5.2 Self-Calibration of Panoramic Scanner
(Faro Photon 120)
As shown in Fig.
11
, a self-calibration has been performed over a dense 3D target
field. There are 138 planar targets have been well-distributed on the four walls and
the ceiling of the laboratory with dimensions 15.5 m (length) 9 9 m (width) 9 3m
(height).
Seven scan stations were established to capture the targets coordinates. As
shown in Fig.
12
, five scan stations were located at each corner and centre of the
room. The other two were positioned close to the two corners and the scanner
orientation were manually rotated 90 from scanner orientation at the same corner.
In all cases the height of the scanner was midway between the floor and the ceiling.
In this experiment, the scan resolution was set to the 1/4 setting which is
equivalent to the medium resolution. Higher resolution scans were not captured
due to the longer time required to complete the scanning. Furthermore, medium
resolution was sufficient for Faro scene V4.8 software to extract all targets except
for those which have high incidence angle. After completing the scanning process,
a bundle adjustment was performed with precision setting based on the accuracy of
the scanner, which are 2 mm for distance and 30
00
for both angles measurement.
5.3 Evaluation of Calibrated Data
With the aid of residual graphs and statistical analysis, the significant calibration
parameters can be determined. Having these significant parameters, that infor-
mation then was applied to the raw data in order to remove the systematic errors
which finally yield the calibrated data. By subtracting true value of vectors with