Geoscience Reference
In-Depth Information
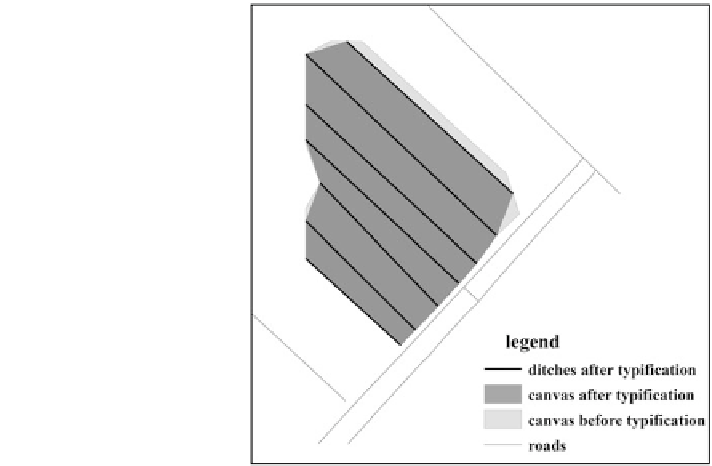
Fig. 6
Evaluation of the
result
typification presents a good result. The calculation is shown in formula (5), where
S is the area of the canvas of those initial ditches, while T is the area of the canvas
of ditches that have been typified, S
\
T is the area of the overlap of canvas of
ditches before and after typification. It is worth noting that the Similarity ranges
from 0 to 1 in this study.
The evaluation of the result is shown in Fig.
6
for the case that is displayed in
Fig.
5
d. The value of Similarity is determined as 0.933. Presuming that there are
n ditch clusters, the average Similarity would be the average value of that for the
n ditch clusters.
4 Experiment
Part of the Guangzhou ditch data was selected to verify the method in this study.
As can be seen from the areas that are marked in the red ovals in Fig.
7
a, ditches at
the upper location have an irregular parallel distribution pattern, while the lower
group of ditches is more regular distributed. Therefore, the data is very suitable for
the experiment. The experimental result is shown in Fig.
7
b, where the average
Similarity is 0.851. Therefore, the proposed approach preserves the distribution
pattern effectively.
It should be mentioned that the approach has some shortcomings. (1)
K-means++ algorithm in the representation step was selected with good perfor-
mance but may not be the best in the initial seed selection. The uncertainty may be
induced significantly by the selection of the initial seed methods. Practically, we