Geoscience Reference
In-Depth Information
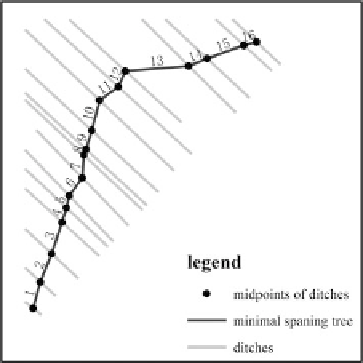
Fig. 3 Minimal spanning
tree of ditches
Table 1
Cognition distance between ditches
ID
AverDistance
AngleDiference
OverlapDegree
CognitionDistance
1
48.531
4.427
0.613
91.697
2
55.831
0.042
0.730
71.133
3
59.584
0.666
0.842
72.590
4
26.886
0.972
0.937
30.772
5
20.613
2.817
0.945
26.647
6
43.227
0.007
0.972
44.465
7
34.107
2.951
0.898
46.449
8
11.395
0.384
0.985
11.916
9
34.790
0.007
0.951
36.504
10
54.088
0.635
0.922
61.190
11
44.645
1.053
0.978
49.404
12
32.380
0.053
0.865
36.896
13
93.481
2.273
0.702
143.246
14
35.692
1.782
0.931
43.526
15
68.490
0.438
0.797
85.247
16
21.660
0.758
0.899
25.268
3.2 Ditch Representation Based on K-means++ Algorithm
After grouping the ditches, the next step would be representation. This step
replaces the original clusters by a smaller number of objects. In the meantime, the
distribution characteristics of the initial pattern need to be preserved. Thus, three
questions need to be answered. How many ditches should be contained in the new
group? How to represent the initial objects by new ones and how to evaluate the
results?