Geoscience Reference
In-Depth Information
(a)
(b)
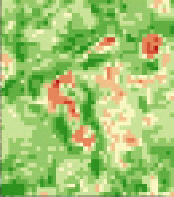
Legend:
<0.2 : Cleared Land and Built-up Area
0.2 NDVI<0.5 : Mix of Built-up / Bare Soil and Vegetation
0.5 : Fully Vegetated
Cloud Cover
Fig. 4
Vegetation growth in a 1991 and b 2009
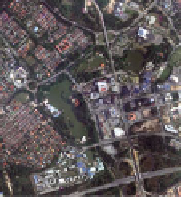
(a)
(b)
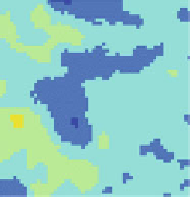
(c)
High
High
Low
Low
Fig. 5 a Orthophoto image, b NDVI map and c surface temperature of the detailed study area in
Shah Alam
4.4 Transect Profile Between Surface Temperature
and NDVI
As shown in Fig.
8
a, the cross section profiles pass through residential area (
Sect.
3
), urban park (i.e.; water body, high density trees and vegetation) and adminis-
trative building. Figure
8
b shows the NDVI value range from -0.2 to 0.28 and the
surface temperature range from 25.5 C in urban park area to 29.9 C (max) in
commercial area. The difference in the surface temperature between built-up areas
and high density tree areas is more than 4 C. As the profile line crossed over the
grass area the temperature remain unchanged. It is clear that grass does not