Geoscience Reference
In-Depth Information
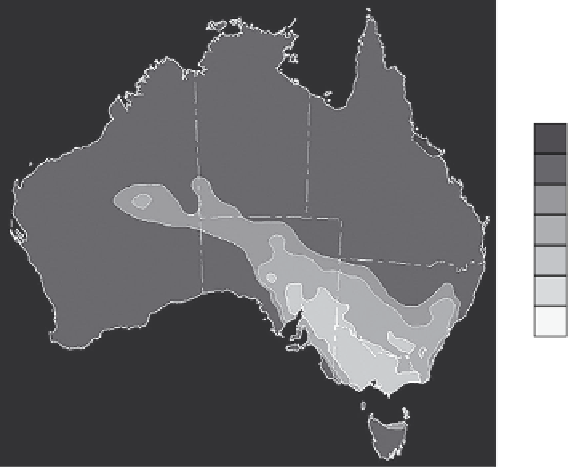
Temperature Percentiles
100th
> 99th
> 97th
3rd to 97th
< 3rd
< 1st
0th
Daily Maximum Te mperature Extremes
24 hours from 9am on 07 Feb 2009
Product of the National Climatic Centre
Figure 3.5
Daily maximum temperature extremes for 7 February 2009
Source: Bureau of Meteorology (Australia)
Note
a Temperatures are displayed as percentiles. Percentile analysis is a way of determining
how unusual a temperature event is. To determine whether a temperature observation
is unusual for a particular month, it is compared with all other rainfall and
temperature daily observations in the same month in the climate record (1950 to
present for daily analyses). All the observations for that month are ranked in order,
from coolest to hottest for temperature, and driest to wettest for rainfall and then
broken into 100 equal groups. The first group is the 1st percentile, the second group
the 2nd percentile and so on. Red shows the area over which the day was the hottest
February day on record.
Extreme rainfall and drought
Changes in average rainfall have been observed across parts of Australia since
1950, but trends are less clear than for increases in temperature. The most statis-
tically significant changes, those clearly discernable from background rainfall
variability, have been observed declines in late autumn and winter rainfall across
southern Australia, in particular south-west Western Australia. Declines in
rainfall have also been observed across the eastern half of Australia, particularly
the south east of the continent. The large inherent variability of rainfall across
Queensland and the northern and central Murray-Darling Basin means that a
pattern of change cannot be assumed from apparent rainfall declines with little
statistical significance (Le Blanc et al., 2012). Similarly, monsoonal rainfall
increases across the tropical north and north west have occurred against a
background of large natural variability.