Geoscience Reference
In-Depth Information
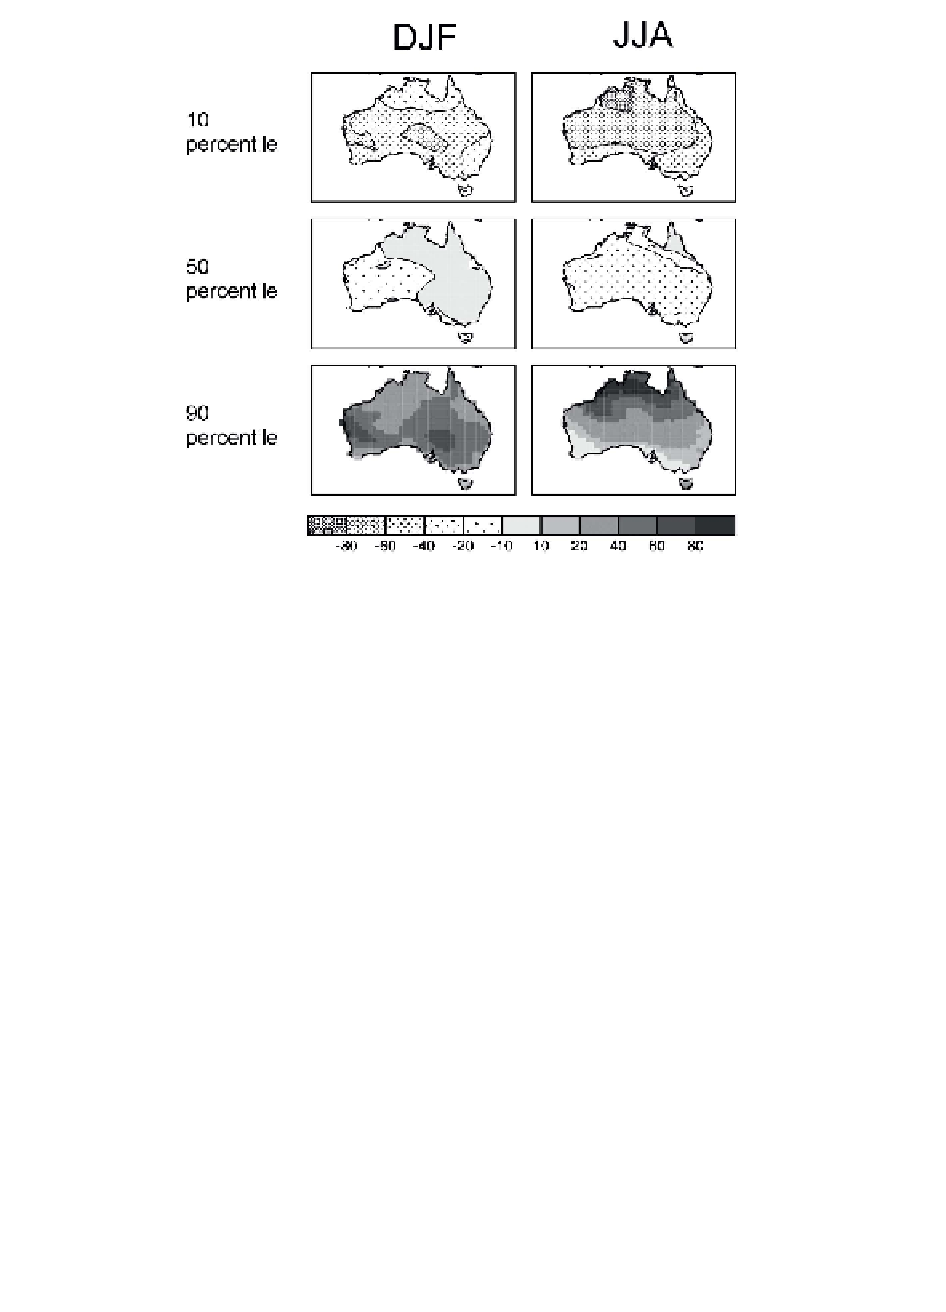
JJA
DJF
10
percentile
.. ",
tf0
~
.......
50
percentile
.
.
.
.
.
.
.' . 2)'. .
. ................... .
.
....................... .
-: -:-:-:-:-:-:-:-:-:-:-:-:.
.........
. . .
.
......... .
. .
....
. ........ .
90
percentile
-80
-60
-40
-20
-10
10
20
40
60
80
summer and winter and for selected percentiles of the global climate model-
based uncertainty range
Notes
a Summer = DJF; winter = JJA.
b Based on the method of Watterson (2008).
provided by the climate models, it needs to be noted that local rainfall changes
can be signifi cantly modifi ed by mountain ranges not adequately represented
by the models. A recent application of high-resolution modelling to Tasmania
(Grose et al., 2010) led to signifi cant differences in simulated rainfall change
from those in the coarser resolution climate model.
Combined temperature and rainfall scenarios
What, in real terms, might these trends and shifts in climate mean? To illustrate
the potential environmental signifi cance of the changes to average temperature
and precipitation described above, we consider places that provide spatial
analogues based on Australia's current climate for
1
4°C global warming for
selected sites: in other words, where in Australia at present is most like - in terms
of temperature or rainfall - what we can expect in a Four Degree World for, say,
Melbourne or Sydney.