Geoscience Reference
In-Depth Information
12
10
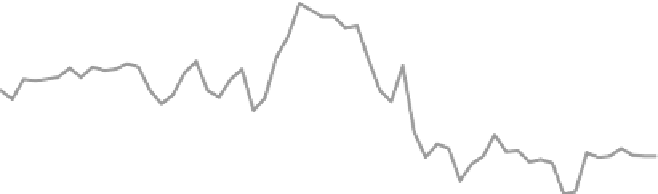
rock abundance
isotopes
8
6
4
2
0
0
100
200
300
400
500
600
Age (millions of years)
Figure 11.2. rates of organic carbon burial calculated from both rock abundance data and
from isotopes. redrafted from Berner and Canfield (1989), using the time scale known at
the time of the publication; most of the period boundaries have changed somewhat in time
since then (see Preface).
results. This makes one think that, at least through the Phanerozoic
Eon, both the geologic record of preserved sediment types and the
carbon isotope record are telling us something similar and fundamental
about the carbon cycle.
8
This puts us in a good position to perhaps say
something important about the evolution of oxygen concentrations
through the Phanerozoic Eon.
This also brings us to the model results, which are shown in
igure
11.3.
The gray area in the plot marks Bob's best estimate of the likely
range in oxygen concentration as revealed by various sensitivity analy-
ses, while the line is Bob's view of the best model result. The model
clearly shows variations in atmospheric oxygen content. Sensitivity anal-
yses revealed that rapid recycling was important to dampen fluctuations
in atmospheric oxygen content and also that the organic matter content
(in particular) and pyrite sulfur content (of lesser significance) of the
various sediment types mattered a great deal. In contrast, the area of
continent available for weathering mattered little, as did the total rate
of sedimentation as explained above.
hat mattered most, though, was the type of sediment deposited.
The most obvious feature of the plot is the large positive oxygen excur-