Geoscience Reference
In-Depth Information
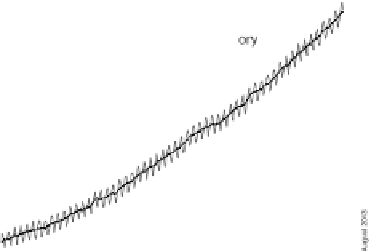
The Keeling Curve—atmospheric CO
2
at Mauna Loa Observatory, 1960-2013.
The Keeling Curve is the oscillating line, which tracks the actual monthly
average of CO
2
over time. The solid upward slope is the same data corrected for
the seasonal cycles that cause the oscillations, which correlates with the annual
average of CO
2
. Dr. Pieter Tans, NOAA/ESRL (www.esrl.noaa.gov/gmd/ccgg/
trends) and Dr. Ralph Keeling, Scripps Institution of Oceanography (http://
scrippsco2.ucsd.edu).
Charles David Keeling in the laboratory at the Scripps Institution of Ocean-
ography, 1996. Credit: SIO Photographic Laboratory, Scripps Institution of
Oceanography Archives, UC San Diego Library.