Geoscience Reference
In-Depth Information
1.0
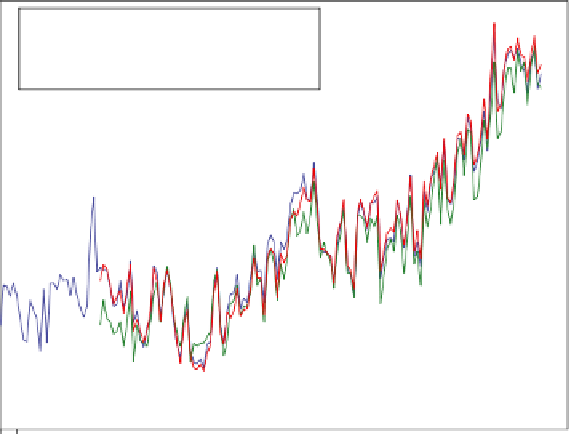
Hadley Center
National Climatic Data Center
GISS
0.8
0.6
0.4
0.2
0.0
-0.2
-0.4
1860
1880
1900
1920
1940
1960
1980
2000
2020
Figure 8.
Global temperature trend as constructed by three research groups, 1850- 2012.
The second approach applies integrated assessment models (IAMs),
the economic models discussed in Chapter 3. These models combine
population, technology, energy sectors, and economic growth as well as
carbon cycles and climate models. They construct what might be called
a combined best estimate of climate change over the coming years. For
this calculation, I use the average of CO
2
concentrations from the differ-
the temperature projections from climate models reviewed by the IPCC
using the stylized emissions scenarios.
in the middle indicate the average of the EMF-22 models (dashed line)
and the results from the RICE model (heavy solid line). This picture
provides a good overview of different future climate-change possibili-
ties predicted by multiple modeling groups around the world.
Let's focus on the IAMs. Although the models have different as-
sumptions about economic growth, population, the energy sector, new
technologies, and the carbon cycle, they generate very similar tempera-