Geoscience Reference
In-Depth Information
140
DICE model
Average of EMF models
120
100
80
60
40
20
0
2000
2010
2020
2030
2040
2050
2060
2070
2080
2090
2100
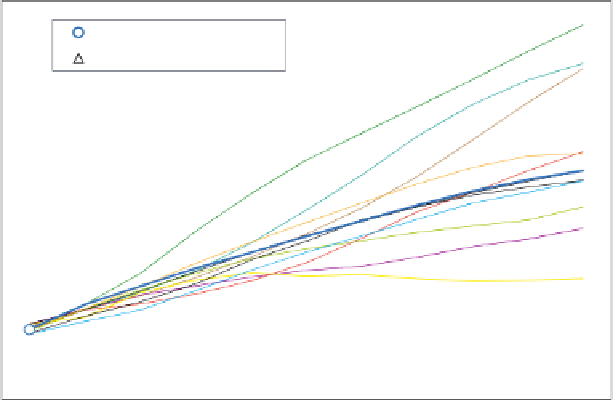
Figure 5.
Projections for baseline CO
2
emissions.
UNCERTAIN CO
2
TRAJECTORIES IN THE CLIMATE CASINO
Figure 5 shows an example of the Climate Casino at play. A fi rst
point that emerges is that all models—every single one—project con-
tinued growth in CO
2
emissions. Growth rates range between 0.5 per-
cent and 1.7 percent per year over the 2000-2100 period. Even though
these rates look small, they add up to large cumulative changes due to
the compounding effect over time. For example, the average growth
rate of 1.2 percent per year means an increase of a factor of 3.3 over a
century. These models represent the best efforts of economic and en-
ergy experts today, and they indicate that the CO
2
problem is not going
to disappear or be magically solved by unrestrained market forces.
The second point concerns the uncertainty about future emissions.
Because of the momentum of economic and technological systems, the
near-term projections show few differences. However, the divergence
among different projections splays out as we go further into the future.
This is visualized in the spaghetti diagram of projections in Figure 5.
Model projections of CO
2
emissions for 2100 range from 1.6 to 5.4 times
higher than in 2000. The reasons for the divergence go back to the