Geoscience Reference
In-Depth Information
40
30
Global CO
2
emissions
Trend (2.6% per year)
20
10
8
6
4
3
2
1
1900
1920
1940
1960
1980
2000
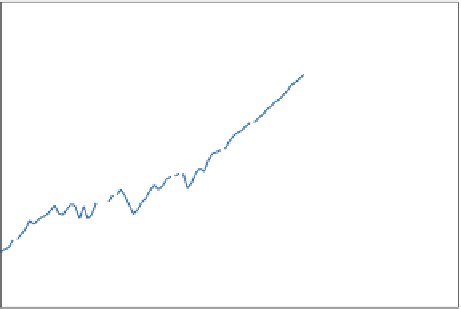
Figure 2.
Global CO
2
emissions, 1900-2010.
The net effect of all these decisions around the world is shown in
Figure 2, which displays the long-term trend in global CO
2
emissions
growth and of slow growth, but on average, emissions grew at a rate
of 2.6 percent per year. This upward trend is the source of our worry.
These rising emissions are leading to rising CO
2
concentrations in the
atmosphere, which is what produces climate change.
I note here one geeky detail about the fi gure: The vertical scale on
the diagram, and on several others in this topic, is a ratio scale. This is a
diagram in which equal vertical distances have equal proportions; thus,
for example, the vertical distance from 200 to 400 is the same as that
from 400 to 800. Ratio scales are convenient because a straight line
(one with a constant slope) has a constant rate of growth or decline. If
you look at Figure 3, you see that a given percentage increase looks the
same no matter where it occurs on the chart.
It will be useful to give the global totals here. Global CO
2
emissions
have been growing because the global economy has been growing. The
world's population has expanded from around 2 billion in 1900 to over