Geoscience Reference
In-Depth Information
65
60
55
50
45
40
35
30
1996
1998
2000
2002
2004
2006
2008
2010
2012
2014
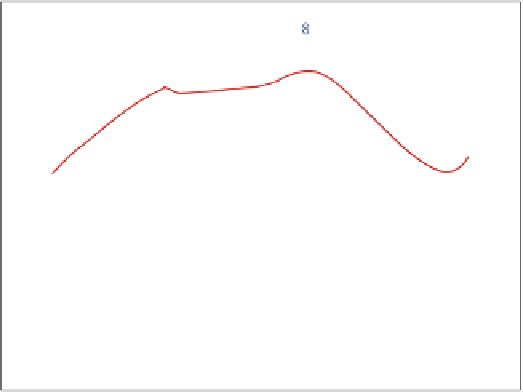
Figure 42.
Fraction of population saying that global warming is real. This fi gure
synthesizes data on public views in the United States on global warming. While
the questions differ, they typically are “Do you think the earth is warming?” The dots
are the individual surveys, while the solid line is a statistical fi t.
veys asked, “From what you've read and heard, is there solid evidence
that the average temperature on earth has been getting warmer over
the past few decades, or not?” I linked the surveys together and created
a composite survey. The results from the sixty-seven individual surveys
and the composite are shown in Figure 42.
3
The survey data indicate an interesting pattern, one not seen in
the other results on scientifi c understanding. Public understanding and
agreement with climate science in the United States rose markedly
from the late 1990s to the mid-2000s. Then agreement with the sci-
ence took a sharp nosedive after 2006. The composite series fell from
a peak of about 58 percent agreement in 2007 to less than 50 percent
in 2010.
Scientists may be glad to note that there appears to have been some
upturn in public agreement with the basic science in the last two years.