Geoscience Reference
In-Depth Information
20
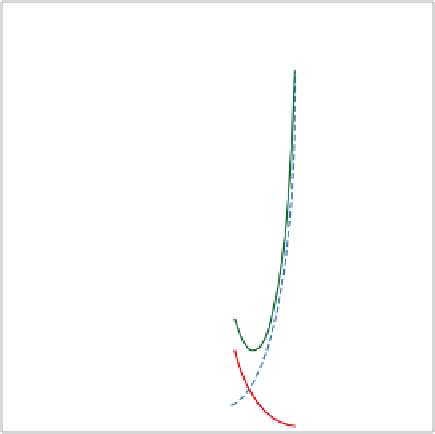
Total discounted
Damages with tipping costs
Abatement (limited part.)
16
12
8
4
0
0
1
2
3
4
5
6
Global temperature limit (°C)
Figure 32.
Climate policy with a sharp tipping point at 3
1
⁄
2
°C. The fi nal example has
a threshold or tipping point at a temperature increase of 3
1
⁄
2
°C in a situation with
discounting and limited participation. This shows that the optimal temperature increase
is very close to the threshold. It is constrained on the low side by abatement costs and
on the high side by the sharp increase in damages.
elements such as tipping points, abrupt climate change, sharp discon-
tinuities, and catastrophes.
The diffi culty of including tipping points is not the analytical one of
adding these strange elements to our models. Rather, it is an empirical
problem that comes from our inability to predict the impacts of the
threshold damages reliably. Take the threshold damage function shown
in Figure 32 as an example. This curve makes assumptions about three