Geoscience Reference
In-Depth Information
question for many years. I summarize the results but must also empha-
size the diffi culties and dynamic nature of the analysis.
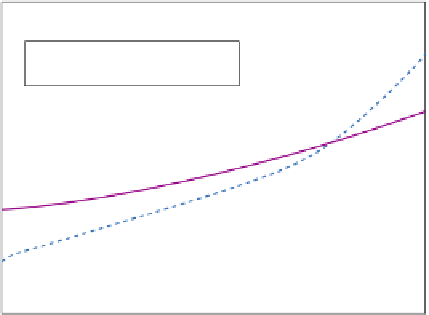
There are many estimates, and they vary widely. Figure 25 shows
the results from two different methodologies—the engineering or
Start with the bottom-up models. A bottom-up approach estimates the
costs by looking at a suite of different technologies, such as those used
in cars, blast furnaces, power plants, and the like. It then asks how we
can reduce emissions for each sector, and at what cost. Our examples of
refrigerators and power plants were rudimentary bottom-up estimates.
These are typical of how an engineer would approach the question,
looking at different products or processes and asking how they can be
redesigned to reduce carbon emissions in an effi cient manner.
Now look at Figure 25. The vertical axis shows the average cost of
emissions reductions as a percentage of income, while the horizontal axis
2.0
1.5
Economic (top-down)
Engineering (bottom up)
1.0
0.5
0.0
-0.5
-1.0
0
10
20
30
40
Percent reduction CO
2
emissions (2025)
Figure 25.
The average cost of reducing GHG emissions, 2025. This fi gure shows an
estimate of the average cost of reducing emissions in the most effi cient manner for the
world as a whole. Estimates for the United States differ slightly but have the same shape.