Geoscience Reference
In-Depth Information
0.9
Unconstrained
T
<
2 °C
SRES A1B
History
0.8
_
0.7
0.6
0.5
0.4
0.3
0.2
0.1
0.0
1900
1920
1940
1960
1980
2000
2020
2040
2060
2080
2100
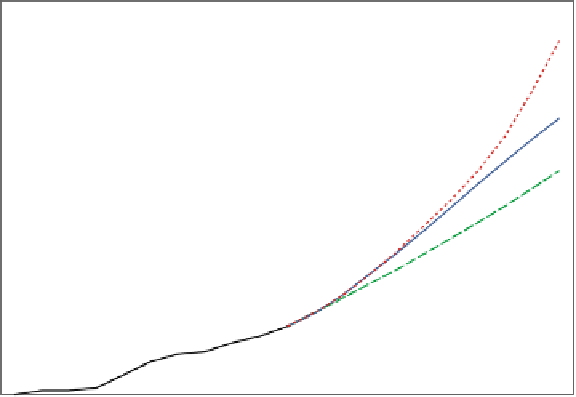
Figure 16.
History and projected sea level for uncontrolled and temperature-limited
scenarios, 1900-2100. The fi gure shows the history and a comparison of two DICE
model SLR projections (unconstrained emissions and a limit of 2°C increase in global
temperature) with that of the average of IPCC models for unconstrained emissions
(SRES A1B) over the next century. Note that, even with an ambitious policy to limit
warming, there will be substantial SLR.
Figures 16 and 17 show the DICE model SLR projections for the two
policies along with the related IPCC run closest to this projection (IPCC
SRES scenario A1B). Figure 16 shows the history of the global sea level
The DICE model for unconstrained emissions has higher estimates of
SLR than comparable IPCC climate scenarios. This result occurs be-
cause the DICE model includes all ice sheets and uses parameters that
show greater sensitivity to temperature increases than most models.
Note that there are only small differences among the alternative
models and scenarios over the next few decades. The similarity among
the paths during the early decades of this century illustrates the tre-
mendous inertia of many earth systems, which is one of the recurring
themes of climate change.